AP Board 8th Class Maths Notes Chapter 9 Area of Plane Figures

Students can go through AP Board 8th Class Maths Notes Chapter 9 Area of Plane Figures to understand and remember the concepts easily.

AP State Board Syllabus 8th Class Maths Notes Chapter 9 Area of Plane Figures

→ Area of a triangle = [latex]\frac{1}{2}[/latex] × base × height = [latex]\frac{1}{2}[/latex] bh

→ Area of a quadrilateral = [latex]\frac{1}{2}[/latex] × length of a diagonal × Sum of the lengths of the perpendiculars drawn from the remaining two vertices on the diagonal
= [latex]\frac{1}{2}[/latex] d(h1 + h2)

AP Board 8th Class Maths Notes Chapter 9 Area of Plane Figures

→ Area of a trapezium = [latex]\frac{1}{2}[/latex] × sum of the lengths of parallel sides × distance between them
= [latex]\frac{1}{2}[/latex] h(a + b)

→ Area of a rhombus = Half of the product of diagonals = [latex]\frac{1}{2}[/latex] d1d2

→ Angle at the centre of a circle = 360°

→ Area of a circle = πr2
Where ‘r’ is the radius of the circle, π = [latex]\frac{22}{7}[/latex] or 3.14 nearly

→ Circumference of a circle = 2πr

AP Board 8th Class Maths Notes Chapter 9 Area of Plane Figures

→ Area of a circular path (or) Area of a Ring = π(R2 – r2) or π(R + r) (R- r)
When R, r are radii of outer circle and inner circle respectively.

→ Width of the path w = R – r

→ Area of a sector A = [latex]\frac{x^{\circ}}{360^{\circ}}[/latex] × πr2 where x° is the angle subtended by the arc of the sector at the center of the circle and r is radius of the circle. (OR) A = [latex]\frac{lr}{2}[/latex] where Tis thdength of the arc.
Length of the arc of a sector = [latex]\frac{x^{\circ}}{360^{\circ}}[/latex] × 2πr

AP Board 8th Class Maths Notes Chapter 8 Exploring Geometrical Figures

Students can go through AP Board 8th Class Maths Notes Chapter 8 Exploring Geometrical Figures to understand and remember the concepts easily.

AP State Board Syllabus 8th Class Maths Notes Chapter 8 Exploring Geometrical Figures

→ Shapes are said to be congruent if they have same shape and size.

→ Shapes are said to be similar if they have same shapes but in different size.

→ If we flip, slide or turn the congruent/similar shapes their congruence/similarity remain the same.

AP Board 8th Class Maths Notes Chapter 8 Exploring Geometrical Figures

→ Some figures may have more than one line of symmetry.

→ Symmetry is of three types namely line symmetry, rotational symmetry and point symmetry.

→ With rotational symmetry, the figure is rotated around a central point so that it appears two or more times same as original.

→ The number of times for which it appears the same is called the order.

→ The method of drawing enlarged or reduced similar figures is called Dialation.

→ The patterns formed by repeating figures to fill a plane without gaps or overlaps are called tessellations.

→ Flip: Flip is a transformation in which a plane figure is reflected across a line, creating a mirror image of the original figure.
AP Board 8th Class Maths Notes Chapter 8 Exploring Geometrical Figures 1

→ After a figure is flipped or reflected, the distance between the line of reflection and each point on the original figure is the same as the distance between the line of reflection and the corresponding point on the mirror image.

AP Board 8th Class Maths Notes Chapter 8 Exploring Geometrical Figures

→ Rotation: “Rotation “means turning around a center.
The distance from the center to any point on the shape stays the same. Every point makes a circle around the center.
AP Board 8th Class Maths Notes Chapter 8 Exploring Geometrical Figures 2
There is a central point that stays fixed and everything else moves around that point in a circle.
A “Full Rotation” is 360°.

→ Now observe the following geometrical figures.
AP Board 8th Class Maths Notes Chapter 8 Exploring Geometrical Figures 3
In all the cases if the first figure in the row is moved, rotated and flipped do you find any change in size and shape? No, the figures in every row are congruent they represent the same figure but oriented differently.

AP Board 8th Class Maths Notes Chapter 8 Exploring Geometrical Figures

→ If two shapes are congruent, still they remain congruent if they are moved or rotated. The shapes would also remain congruent if we reflect the shapes by producing their mirror images.

→ We use the symbol ≅ to represent congruency.

AP Board 8th Class Maths Notes Chapter 7 Frequency Distribution Tables and Graphs

Students can go through AP Board 8th Class Maths Notes Chapter 7 Frequency Distribution Tables and Graphs to understand and remember the concepts easily.

AP State Board Syllabus 8th Class Maths Notes Chapter 7 Frequency Distribution Tables and Graphs

→ The Central Tendencies are 3 types. They are

  1. Arithmetic Mean
  2. Median
  3. Mode

→ Information, available in the numerical form or verbal form or graphical form that helps in taking decisions or drawing conclusions is called Data.

→ Arithmetic mean of the ungrouped data = AP Board 8th Class Maths Notes Chapter 7 Frequency Distribution Tables and Graphs 1 
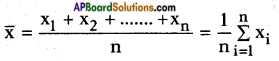
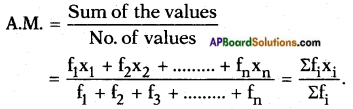
(short representation) where ∑xi represents the sum of all xis, where ‘i’ takes the values from 1 to n.

AP Board 8th Class Maths Notes Chapter 7 Frequency Distribution Tables and Graphs

→ Arithmetic mean = Estimated mean + Average of deviations
AP Board 8th Class Maths Notes Chapter 7 Frequency Distribution Tables and Graphs 2

→ Mean is used in the analysis of numerical data represented by unique value.

→ Median represents the middle value of the distribution arranged in order.

→ The median is used to analyse the numerical data, particularly useful when there are a few observations that are unlike mean, it is not affected by extreme values.

→ Mode is used to analyse both numerical and verbal data.

→ Mode is the most frequent observation of the given data. There may be more than one mode for the given data.

→ Representation of classified distinct observations of the data with frequencies is called ‘Frequency Distribution’ or ‘Distribution Table’.

→ Difference between upper and lower boundaries of a class is called length of the class denoted by ‘C’.

→ In a class the initial value and end value of each class is called the lower limit and upper limit respectively of that class.

AP Board 8th Class Maths Notes Chapter 7 Frequency Distribution Tables and Graphs

→ The average of upper limit of a class and lower limit of successive class is called upper boundary of that class.

→ The average of the lower limit of a class and upper limit of preceding class is called the lower boundary of the class.
The progressive total of frequencies from the last class of the table to the lower boundary of particular class is called Greater than Cumulative Frequency (G.C.F).

→ The progressive total of frequencies from first class to the upper boundary of particular class is called Less than Cumulative Frequency (L.C.F.).

→ Histogram is a graphical representation of frequency distribution of exclusive class intervals. When the class intervals in a grouped frequency distribution are varying we need to construct rectangles in histogram on the basis of frequency density.
Frequency density = [latex]\frac{\text { Frequency of class }}{\text { Length of that class }}[/latex] × Least class length in the data

→ Frequency polygon is a graphical representation of a frequency distribution (discrete/ continuous).

AP Board 8th Class Maths Notes Chapter 7 Frequency Distribution Tables and Graphs

→ Infrequency polygon or frequency curve, class marks or mid values of the classes are taken on X-axis and the corresponding frequencies on the Y-axis.

→ Area of frequency polygon and histogram drawn for the same data are equal.

→ A graph representing the cumulative frequencies of a grouped frequency distribution against the corresponding lower/upper boundaries of respective class intervals is called Cumulative Frequency Curve or “Ogive Curve”.

AP Board 8th Class Maths Notes Chapter 6 Square Roots and Cube Roots

Students can go through AP Board 8th Class Maths Notes Chapter 6 Square Roots and Cube Roots to understand and remember the concepts easily.

AP State Board Syllabus 8th Class Maths Notes Chapter 6 Square Roots and Cube Roots

→ The product of two same numbers is called its square.
Ex: 1) x × x = x2
2) 6 × 6 = 62 = 36

→ The digits in the units place of a square number are 0, 1, 4, 5, 6, 9.

→ If the digits 2,3, 7 or 8 are in the units place of an umber then it is not a perfect square.

AP Board 8th Class Maths Notes Chapter 6 Square Roots and Cube Roots

→ If there are ‘n’ digits in a number then the no.of digits in its square = 2n or (2n -1).

→ Sum of ‘n ‘ consecutive odd numbers = n2

→ The square of any odd number say ‘n’ can be expressed as the sum of two consecutive numbers as
AP Board 8th Class Maths Notes Chapter 6 Square Roots and Cube Roots 1

→ If a, b, c are any three positive integers and a2 + b2 = c2 then a, b, c are called Pythagorean triplets. Ex: (3, 4, 5) (5, 12, 13).

→ If a square number is expressed, as the product of two equal factors, then one of the factors is called the square root of that square number. Thus, the square root of 169 is 13. It can be expressed as √169 = 13 (symbol used for square root is √). Thus it is the inverse operation of squaring.

→ If the same number is multiplied itself by 3 times then it is called a cube of a number. Ex: cube of x = x × x × x = x3

AP Board 8th Class Maths Notes Chapter 6 Square Roots and Cube Roots

→ If a cube number is expressed, as the product of 3 equal factors, then one of he factors is called the cube root of that number.
Symbol for cube root is [latex]\sqrt[3]{ }[/latex]
Ex: [latex]\sqrt[3]{64}=\left(4^{3}\right)^{1 / 3}[/latex] = 4


AP Board 8th Class Maths Notes Chapter 6 Square Roots and Cube Roots 2

AP Board 8th Class Maths Notes Chapter 5 Comparing Quantities Using Proportion

Students can go through AP Board 8th Class Maths Notes Chapter 5 Comparing Quantities Using Proportion to understand and remember the concepts easily.

AP State Board Syllabus 8th Class Maths Notes Chapter 5 Comparing Quantities Using Proportion

→ Two simple ratios are expressed like a single ratio as the ratio of product of antecedents to product of consequents and we call it compound ratio of the given two simple ratios.
a : b and c : d are any two ratios, then their compound ratio is [latex]\frac{a}{b}[/latex] × [latex]\frac{c}{d}[/latex] = [latex]\frac{ac}{bd}[/latex] i.e. ac : bd.

→ A percentage(%) compares a number to 100. The word percent means “per every hundred” or “out of every hundred”. 100% = [latex]\frac{100}{100}[/latex] it is also a fraction with denominator 100.

→ Discount is a decrease percent of marked price. Price reduction is called rebate or discount. It is calculated on marked price or list price.

AP Board 8th Class Maths Notes Chapter 5 Comparing Quantities Using Proportion

→ Profit or loss is always calculated on cost price. Profit is an example of increase percent of cost price and loss is an example of decrease percent of cost price.

→ VAT will be charged on the selling price of an item and will be included in the bill.
VAT is an increase percent on selling price.

→ Simple interest is an increase percent on the principal.

→ Simple interest (I) = [latex]\frac{P \times T \times R}{100}[/latex]
where P = Principal, T = Time inyears, R = Rate of interest.

→ Amount = Principal + Interest = P + [latex]\frac{P \times T \times R}{100}[/latex] = P[latex]\left(1+\frac{T \times R}{100}\right)[/latex]

→ Compound interest allows you to earn interest on interest.

→ Amount at the end of ‘n’ years using compound interest is A = P [latex]\left(1+\frac{R}{100}\right)^{n}[/latex]

AP Board 8th Class Maths Notes Chapter 5 Comparing Quantities Using Proportion

→ The time period after which interest is added to principal is called conversion period.
When interest is compounded halfyearly, there are two conversion periods in a year, each after 6 months. In such a case, ha If year rate will be half of the annual rate.

→ Note: 1.615 : 1 is called as golden ratio.
In ancient Greece, artists and architects believed there was a particular rectangular shape that looked very pleasing to the eye. For rectangles of this shape, the ratio of long side to the short side is roughly 1.615 : 1. This ratio is very close to what is known as golden ratio.

AP Board 8th Class Maths Notes Chapter 4 Exponents and Powers

Students can go through AP Board 8th Class Maths Notes Chapter 4 Exponents and Powers to understand and remember the concepts easily.

AP State Board Syllabus 8th Class Maths Notes Chapter 4 Exponents and Powers

Laws of Exponents:

→ a × a × a …… m times = am

In am, a is called base; m is called exponent/ power.

→ am × an = am+n

→ [latex]\frac{\mathrm{a}^{\mathrm{m}}}{\mathrm{a}^{\mathrm{n}}}[/latex] = am-n (m > n)
⇒ [latex]\frac{1}{a^{n-m}}[/latex] (m < n)

→ (ab)m = am . bm

→ a0 = 1

AP Board 8th Class Maths Notes Chapter 4 Exponents and Powers

→ a-n = [latex]\frac{1}{a^{n}}[/latex]

→ an = [latex]\frac{1}{a^{-n}}[/latex]

→ [latex]\left(\frac{a}{b}\right)^{m}[/latex] = [latex]\frac{a^{m}}{b^{m}}[/latex]

→ [latex]\left(a^{m}\right)^{n}[/latex] = amn

AP Board 8th Class Maths Notes Chapter 4 Exponents and Powers 1

→ [latex]\sqrt[n]{a}[/latex] = [latex](\mathrm{a})^{1 / \mathrm{n}}[/latex]

AP Board 8th Class Maths Notes Chapter 3 Construction of Quadrilaterals

Students can go through AP Board 8th Class Maths Notes Chapter 3 Construction of Quadrilaterals to understand and remember the concepts easily.

AP State Board Syllabus 8th Class Maths Notes Chapter 3 Construction of Quadrilaterals

→ A closed four sided polygon is called a quadrilateral.

→ A quadrilateral has 4 sides, 4 vertices, 4 angles and 2 diagonals.

AP Board 8th Class Maths Notes Chapter 3 Construction of Quadrilaterals

→ The sum of the 4 angles of a quadrilateral is 360°.

Type of a quadrilateral No. of individual measurements
1. Quadrilateral 5
2. Trapezium 4
3. Parallelogram 3
4. Rectangle 3
5. Rhombus 2
6. Square 1

→ Quadrilateral and their types:
AP Board 8th Class Maths Notes Chapter 3 Construction of Quadrilaterals 1

→ Five independent measurements are required to draw a unique quadrilateral.

AP Board 8th Class Maths Notes Chapter 3 Construction of Quadrilaterals

→ A quadrilateral can be constructed uniquely, if
a) The lengths of four sides and one angle are given
b) The lengths of four sides and one diagonal are given
c) The lengths of three sides and two diagonals are given
d) The lengths of two adjacent sides and three angles are given
e) The lengths of three sides and two included angles are given

→ The two special quadrilaterals, namely rhombus and square can be constructed when two diagonals are given.

AP Board 8th Class Maths Notes Chapter 2 Linear Equations in One Variable

Students can go through AP Board 8th Class Maths Notes Chapter 2 Linear Equations in One Variable to understand and remember the concepts easily.

AP State Board Syllabus 8th Class Maths Notes Chapter 2 Linear Equations in One Variable

→ An algebraic equation is equality of algebraic expressions involving variables and constants.

→ If the degree of an equation is one then it is called a linear equation.

→ If a linear equation has only one variable then it is called a linear equation in one variable or simple equation. ‘

AP Board 8th Class Maths Notes Chapter 2 Linear Equations in One Variable

→ The value which when substituted for the variable in the given equation makes L.H.S. = R.H.S. is called a solution or root of the given equation.

→ Just as numbers, variables can also be transposed from one side of the equation to the other side.
Note: When we transpose terms
‘+’ quantity becomes ’-‘ quantity,
‘-‘ quantity becomes ‘+’ quantity.
‘×’ quantity becomes ‘÷’ quantity.
‘÷’ quantity becomes ‘×’ quantity.
Also
Also,
(+) × (+) = +
(+) × (-) = –
(-) × (+) = –
(-) × (-) = +

AP Board 8th Class Maths Notes Chapter 1 Rational Numbers

Students can go through AP Board 8th Class Maths Notes Chapter 1 Rational Numbers to understand and remember the concepts easily.

AP State Board Syllabus 8th Class Maths Notes Chapter 1 Rational Numbers

→ The numbers which are expressed in the form of [latex]\frac{p}{q}[/latex] where p and q are integers and q ≠ 0, are called “Rational Numbers” which are denoted by the letter ‘Q’.
AP Board 8th Class Maths Notes Chapter 1 Rational Numbers 3

→ Rational numbers are closed under the operations of addition, subtraction and multiplication.

→ Rational numbers are not closed on division.

AP Board 8th Class Maths Notes Chapter 1 Rational Numbers

→ Whole numbers:
AP Board 8th Class Maths Notes Chapter 1 Rational Numbers 1

→ Whole numbers:
AP Board 8th Class Maths Notes Chapter 1 Rational Numbers 2

→ The additive inverse of a is – a. (∵ a + (-a) = 0)

AP Board 8th Class Maths Notes Chapter 1 Rational Numbers

→ The multiplicative inverse of a is [latex]\frac{1}{a}[/latex]. (∵ a × [latex]\frac{1}{a}[/latex] = 1)

→ The operations addition and multiplications are

  1. Commutative for rational numbers.
  2. Associative for rational numbers.

→ ‘0’ is the additive identity for rational number.

→ ‘1’ is the multiplicative identity for rational number.

→ A rational number and its additive inverse are opposite in their sign.

→ The multiplicative inverse of a rational number is its reciprocal.

→ Distributivity of rational numbers a, b and c is a(b + c) = ab + ac and a(b – c) = ab – ac.

→ Rational numbers can be represented on a number line.

→ There are infinite number of rational numbers between any two given rational numbers.

AP Board 8th Class Maths Notes Chapter 1 Rational Numbers

→ The concept of mean help us to find rational numbers between any two rational numbers.

→ The decimal representation of rational numbers is either in the form of terminating decimal or non-terminating recurring decimals.

AP SSC 10th Class Maths Notes Chapter 14 Statistics

Students can go through AP SSC 10th Class Maths Notes Chapter 14 Statistics to understand and remember the concepts easily.

AP State Syllabus SSC 10th Class Maths Notes Chapter 14 Statistics

→ Statistics is a branch of mathematics which deals with collection, organisation, presentation, analysis and interpretation of numerical data.

→ Data is a collection of actual information which is used to make logical inferences.

→ Arithmetic Mean of raw data:
The Arithmetic Mean (A.M.) of a raw data viz. x1, x2, x3, ……., xn is the sum of values of all observations divided by the number of observations.
Arithmetic Mean (A.M.) = AP SSC 10th Class Maths Notes Chapter 14 Statistics 1
Eg.: Sita secured 23, 24, 24, 22 and 20 marks in a test. Her mean marks are
A.M. = [latex]\frac{23+24+24+22+20}{5}[/latex] = [latex]\frac{113}{5}[/latex] = 22.6

AP SSC 10th Class Maths Notes Chapter 14 Statistics

→ A.M. by direct method:
Let x1, x2, x3, ……., xn be observations with respective frequencies f1, f2, ……, fn
i.e., x1 occurs for f1 times, x2 occurs for f2 times, ….., xn occurs for fn times.
AP SSC 10th Class Maths Notes Chapter 14 Statistics 2

→ For a grouped data, it is assumed that the frequency of each class interval is centered around its mid-point and the A.M. is given by A.M. = [latex]\frac{\Sigma \mathrm{f}_{\mathrm{i}} \mathrm{x}_{\mathrm{i}}}{\Sigma \mathrm{f}_{\mathrm{i}}}[/latex]

→ A.M. by deviation method, [latex]\overline{\mathbf{x}}=\mathbf{a}+\frac{\Sigma \mathbf{f}_{\mathbf{i}} \mathbf{d}_{\mathbf{i}}}{\Sigma \mathbf{f}_{\mathbf{i}}}[/latex]
where, a – assumed mean
di – deviation = xi – a.
Step – 1: Choose ‘a’ from the central values.
Step – 2: Obtain di by subtracting a from xi.
Step – 3: Multiply fi and di.
Step – 4: Find ∑fidi and ∑fi .
Step – 5: Find [latex]\overline{\mathbf{x}}=\mathbf{a}+\frac{\Sigma \mathbf{f}_{\mathbf{i}} \mathbf{d}_{\mathbf{i}}}{\Sigma \mathbf{f}_{\mathbf{i}}}[/latex]

→ A.M. by step-deviation method:
AP SSC 10th Class Maths Notes Chapter 14 Statistics 5
Step – 1: Choose ‘a’ from mid values.
Step – 2: Obtain ui = [latex]\frac{x_{i}-a}{h}[/latex].
Step – 3: Multiply fi and ui.
Step – 4: Find Efiui and Sfi.
Step – 5: Find [latex]\overline{\mathrm{x}}=\mathrm{a}+\left(\frac{\Sigma \mathrm{f}_{\mathrm{i}} \mathrm{u}_{\mathrm{i}}}{\Sigma \mathrm{f}_{\mathrm{i}}}\right) \times \mathrm{h}[/latex]

AP SSC 10th Class Maths Notes Chapter 14 Statistics

→ Mode : Mode is the size of variable which occurs most frequently.

→ Mode of a grouped data:
AP SSC 10th Class Maths Notes Chapter 14 Statistics 3
Where, l – lower boundary of the modal class,
h – size of the modal class interval,
f1 – frequency of modal class.
f0 – frequency of the class preceding the modal class.
f2 – frequency of the class succeeding the modal class.

→ Median: Median is defined as the measure of the central items when they are in descending or ascending order of magnitude.

→ Median for a grouped data:
AP SSC 10th Class Maths Notes Chapter 14 Statistics 4
where,
l – lower boundary of median class,
n – number of observations.
cf – cumulative frequency of class preceding the median class.
f – frequency of median class.
h – size of the median class.

→ Cumulative frequency curve or an ogive:
First we prepare the cumulative frequency table, then the cumulative frequencies are plotted against the upper or lower limits of the corresponding class intervals. By joining the points the curve so obtained is called a cumulative frequency or ogive.
Ogives are of two types.

  1. Less than ogive: Plot the points with the upper limits of the classes as abscissa and the corresponding less than cumulative frequencies as ordinates. The points are joined by free hand smooth curve to give less than cumulative frequency curve or the less than ogive. It is a rising curve.
  2. Greater than ogive: Plot the points with the lower limits of the classes as abscissa and the corresponding greater than cumulative frequencies as ordinates. Join the points by a free hand smooth curve to get the greater than ogive. It is a falling curve.

When the points are joined by straight lines, the figure obtained is called cumulative frequency polygon.

AP SSC 10th Class Maths Notes Chapter 14 Statistics

→ Median can be obtained from cumulative frequency curve: From [latex]\frac{n}{2}[/latex] frequency draw a line parallel to X-axis cutting the curve at a point. From this point draw a perpendicular to the axis. The point at which the perpendicular meets the X – axis determines the median.

Less than type and greater than type curves intersects at a point. From this point of intersection if we draw a perpendicular on the X-axis then this cuts X-axis at some point. This point gives the median.

AP SSC 10th Class Maths Notes Chapter 13 Probability

Students can go through AP SSC 10th Class Maths Notes Chapter 13 Probability to understand and remember the concepts easily.

AP State Syllabus SSC 10th Class Maths Notes Chapter 13 Probability

→ Theory of probability has its origin date back to 16th century.

→ J. Cardan, an Italian physician and mathematician wrote the first book on probability named “The Book of Games of Chance”.

AP SSC 10th Class Maths Notes Chapter 13 Probability

→ James Bernoulli (1654 – 1705), A.De Moivre (1667 – 1754) and Pierre Simon Laplace (1749 – 1827) made significant contribution to the theory of probability.

→ Experimental or empirical probability : The probability estimated on the basis of results of an actual experiment is called experimental probability of empirical probability.
Eg : An unbiased coin is tossed for 1000 times, head turned up for 455 times and tail turned up 545 times, then the probability or likelyhood of getting a head is = [latex]\frac{455}{1000}[/latex] = 0.455.

Thus experimental probability = [latex]\frac{\text { No. of trials in which the event happened }}{\text { Total no. of trials }}[/latex]

→ Classical or Theoretical probability: Classical probability of an event (E) is defined Number as

P(E) = [latex]\frac{\text { Number of outcomes favourable to E }}{\text { No. of all possible outcomes of the experiment }}[/latex]

This definition was given by ‘Pierre Simon Laplace’.
Eg: The probability of getting a head when a coin is tossed is given by Number of outcomes favourable to this event getting a head = 1 Number of all possible outcomes of this experiment = 2 (Head, Tail)

∴ P(E) = [latex]\frac{\text { No. of favourable outcomes }}{\text { Total events }}[/latex] = [latex]\frac{1}{2}[/latex]

Note: If an experiment is conducted for many number of times, then the experimental probability may become closer and closer to theoretical probability.
AP SSC 10th Class Maths Notes Chapter 13 Probability 1

AP SSC 10th Class Maths Notes Chapter 13 Probability

→ The probability of a sure event is 1.

→ The probability of an impossible event is zero.

→ The probability of an event E is a number P(E) such that 0 ≤ P(E) ≤ 1.

→ An event having only one outcome is called an elementary event. The sum of the probabilities of all the elementary events of an experiment is 1.

→ For any event E, P(E) + P([latex]\overline{\mathrm{E}}[/latex]) = 1, where E and [latex]\overline{\mathrm{E}}[/latex] are complementary events.

→ Playing cards and their probability : A deck of playing cards consists of 52 cards which are divided into four suits of 13 cards each.
They are:
AP SSC 10th Class Maths Notes Chapter 13 Probability 2

→ The cards in each suit are:
AP SSC 10th Class Maths Notes Chapter 13 Probability 3
Eg : When a card is drawn at random from a deck of cards then

  • Getting a black or red card – equally likely exhaustive events.
  • Getting an ace or king – mutually exclusive.
    AP SSC 10th Class Maths Notes Chapter 13 Probability 4
  • Getting an ace or a hearts – not mutually exclusive since the hearts contain an ace.
    AP SSC 10th Class Maths Notes Chapter 13 Probability 5

AP SSC 10th Class Maths Notes Chapter 13 Probability

→ When a coin is tossed, the outcomes are H, T (Head, Tail).

→ When a dice is thrown the outcomes are 1, 2, 3, 4, 5 and 6.

→ When two dice are thrown, the outcomes are
AP SSC 10th Class Maths Notes Chapter 13 Probability 6

→ If a coin is tossed n-times or n – coins are tossed simultaneously, then the number of total outcomes = 2n.

→ If a dice is thrown for n – times or n – dice are thrown simultaneously then the number of total outcomes = 6n.

AP SSC 10th Class Maths Notes Chapter 12 Applications of Trigonometry

Students can go through AP SSC 10th Class Maths Notes Chapter 12 Applications of Trigonometry to understand and remember the concepts easily.

AP State Syllabus SSC 10th Class Maths Notes Chapter 12 Applications of Trigonometry

→ If a person is looking at an object then the imaginary line joining the object and the eye of the observer is called the line of sight or ray of view.
AP SSC 10th Class Maths Notes Chapter 12 Applications of Trigonometry 1

→ An imaginary line parallel to earth surface and passing through the point of observation is called the horizontal.

→ If the line of sight is above the horizontal then the angle between them is called “angle of elevation”.
AP SSC 10th Class Maths Notes Chapter 12 Applications of Trigonometry 2

→ If the line of sight is below the horizontal then the angle between them is called the angle of depression.
AP SSC 10th Class Maths Notes Chapter 12 Applications of Trigonometry 3

→ Useful hints to solve the problems:

  1. Draw a neat diagram of a right triangle or a combination of right triangles if necessary.
  2. Represent the data given on the triangle.
  3. Find the relation between known values and unknown values.
  4. Choose appropriate trigonometric ratio and solve for the unknown.

→ The height or length of an object or the distance between two distant objects can be determined with the help of trigonometric ratios.

→ To use this application of trigonometry, we should know the following terms.

→ The terms are Horizontal line, Line of Sight, Angle of Elevation and Angle of Depression.

→ Horizontal line: A line which is parallel to earth from observation point to object is called “horizontal line”.
AP SSC 10th Class Maths Notes Chapter 12 Applications of Trigonometry 4

→ Line of Sight (or) Ray of Vision: The line of sight is the line drawn from the eye of an observer to the point in the object viewed by the observer.

→ Angle of Elevation: The line of sight is above the horizontal line then angle between the line of sight and the horizontal line is called “angle of elevation”.
AP SSC 10th Class Maths Notes Chapter 12 Applications of Trigonometry 5
Note:

  1. If the angle of observer moves towards the perpendicular line (pole/tree/ building), then angle of elevation increases and if the observer moves away from the perpendicular line (pole/tree/building), then angle of elevation decreases.
  2. If height of tower is doubled and the distance between the observer and foot of the tower is also doubled, then the angle of elevation remains same.
  3. If the angle of elevation of sun above a tower decreases, then the length of shadow of a tower increases.

→ Angle of Depression: The line of sight is below the horizontal line then angle between the line of sight and the horizontal line is called angle of depression.
AP SSC 10th Class Maths Notes Chapter 12 Applications of Trigonometry 6
Note:

  1. The angle of elevation and depression are always acute angles.
  2. The angle of elevation of a point P as seen from a point ‘O’ is always equal to the angle of depression of ‘O’ as seen from P.

→ Points to be kept in mind:
I. Trigonometric ratios in a right triangle:
AP SSC 10th Class Maths Notes Chapter 12 Applications of Trigonometry 7
AP SSC 10th Class Maths Notes Chapter 12 Applications of Trigonometry 8

II. Trigonometric ratios of some specific angles:
AP SSC 10th Class Maths Notes Chapter 12 Applications of Trigonometry 9

→ Solving Procedure:
When we want to solve the problems of height and distances, we should consider the following :

  1. All the objects such as tower, trees, buildings, ships, mountains, etc. shall be considered as linear for mathematical convenience.
  2. The angle of elevation or angle of depression is considered with reference to the horizontal line.
  3. The height of the observer is neglected, if it is not given in the problem.
  4. To find heights and distances, we need to draw figures and with the help of these figures we can solve the problems.