AP State Syllabus AP Board 7th Class Maths Solutions Chapter 7 Data Handling Ex 4 Textbook Questions and Answers.
AP State Syllabus 7th Class Maths Solutions 7th Lesson Data Handling Exercise 4
![]()
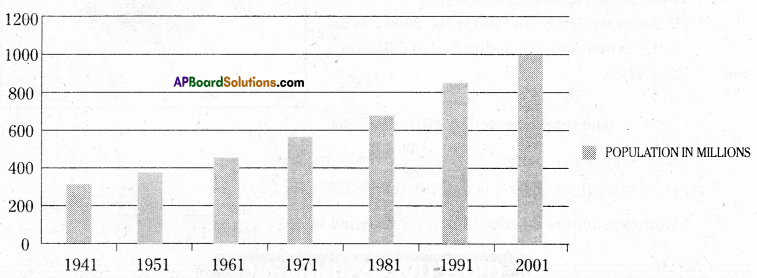
Question 1.
Draw a bar graph for the following data.
Population of India in successive census years-
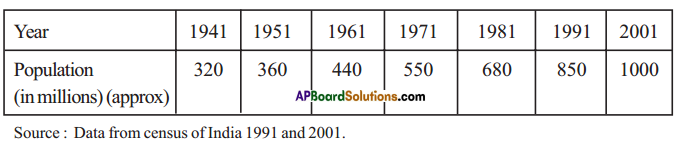
Solution:
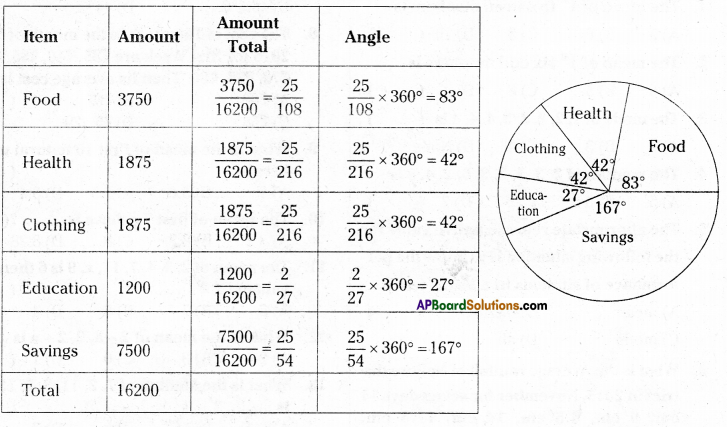
Question 2.
Draw a pie chart for the following data.
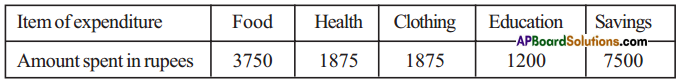
Solution:
![]()
Question 3.
Draw a double bar graph for the following data.
Birth and Death rates of different states in 1999.
Solution:
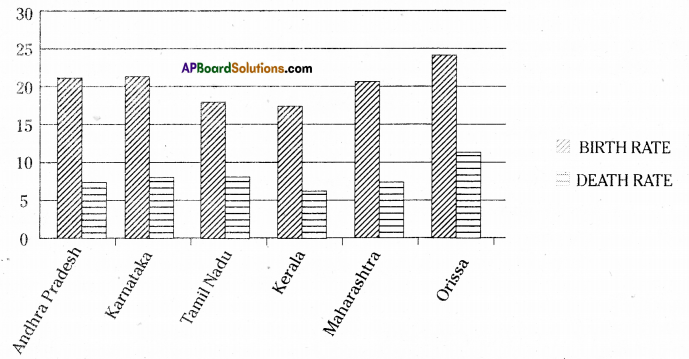
![]()
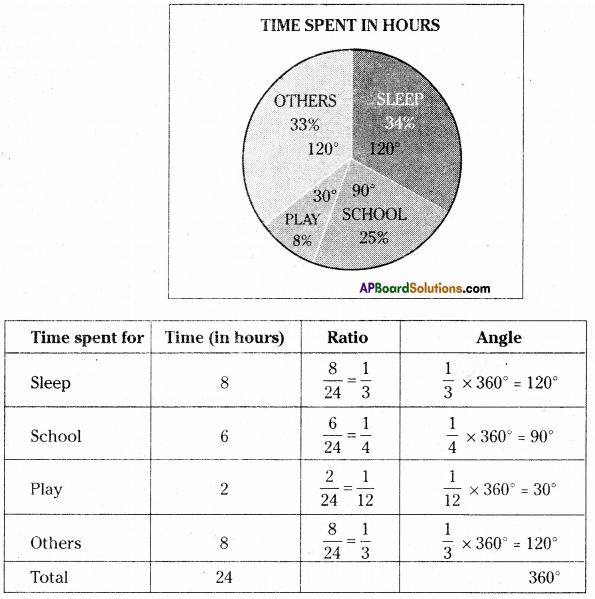
Question 4.
Draw a pie chart for the following data.
Time spent by a child during a day-
Solution:
![]()
Question 5.
The adjoining pic chart gives the expenditure on various items during a month for a family.
(The numbers written around the pie chart tell us the angles made by each sector at the centre.)
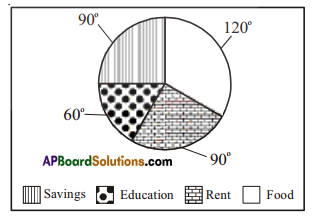
Answer the following –
(i) On which item is the expenditure minimum?
(ii) On which item is the expenditure maximum?
(iii) If the monthly income of the family is ₹ 9000, what is the expenditure on rent?
(iv) If the expenditure on food is ₹ 3000, what is the expenditure on education of children?
Solution:
i) Education
ii) Food
iii) Total income is represented by 360° = Rs. 9,000
food represented by 120 = \(\frac{120}{360}\) × 9000 = Rs. 3000
iv) The expenditure on food is represented by 120 = Rs. 3000
Then expenditure on education is represented by \(\frac{60}{120}\) × 3000 = Rs. 1500