AP State Syllabus AP Board 9th Class Maths Solutions Chapter 9 Statistics Ex 9.1 Textbook Questions and Answers.
AP State Syllabus 9th Class Maths Solutions 9th Lesson Statistics Exercise 9.1
![]()
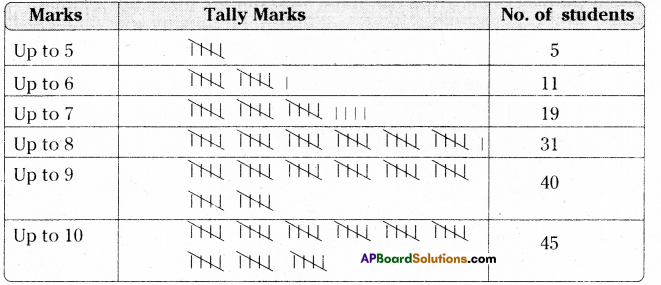
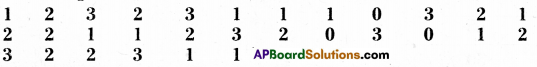
Question 1.
Write the mark wise frequencies in the following frequency distribution table.
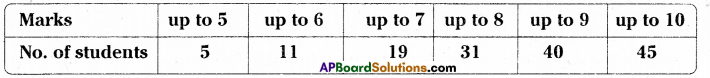
Solution:
![]()
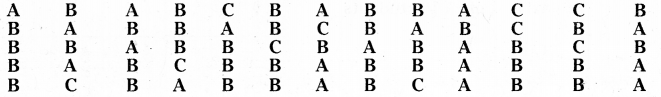
Question 2.
The blood groups of 36 students of IX class are recorded as follows.
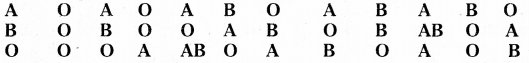
Represent the data in the form of a frequency distribution table. Which is the most common and which is the rarest blood group among these groups ?
| Blood group | A | B | AB | O |
| Frequency | 10 | 9 | 2 | 15 |
From the table, most common group is O and rarest group is AB.
Question 3.
Three coins were tossed 30 times simultaneously. Each time the occurring was noted down as follows :
Prepare a frequency distribution table for the data given above.
Solution:
| No. of heads | 0 | 1 | 2 | 3 |
| Frequency | 3 | 10 | 10 | 7 |
![]()
Question 4.
A T.V. channel organized a SMS (Short Message Service) poll on prohibition on smoking giving options like A – complete prohibitions, B – prohibition in public places only, C – not necessary. SMS results in one hour were
Represent the above data as grouped frequency distribution table. How many appropriate answers were received ? What was the majority of people’s opinion ?
Solution:
| Options | A | B | C |
| Frequency(f) | 19 | 36 | 10 |
Total appropriate answers received = 19 + 36 + 10 = 65
Majority of people’s opinion is prohibition in public places only i.e., B.
Question 5.
Represent the data in the given bar graph as frequency distribution table.
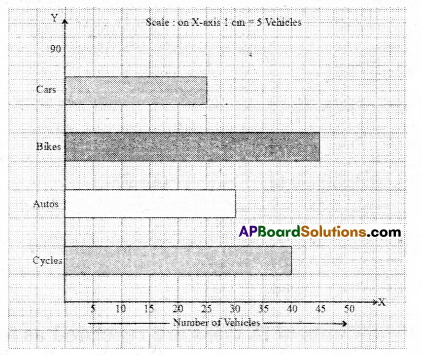
Solution:
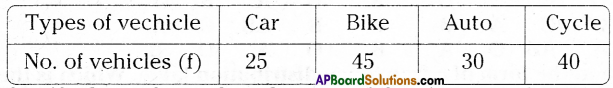
![]()
Question 6.
Identify the scale used on the axes of the given graph. Write the frequency distribu- tion from it.
Solution:
Frequency distribution table :
| Class | No. of students |
| I | 40 |
| II | 55 |
| III | 65 |
| IV | 30 |
| V | 15 |
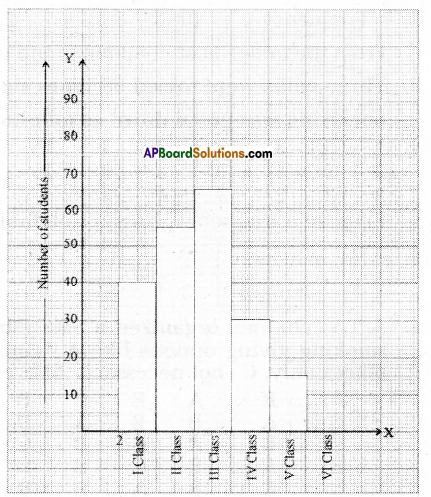
Scale : X – axis : 1 cm = 1 class interval
Y – axis : 1 cm = 10 students
![]()
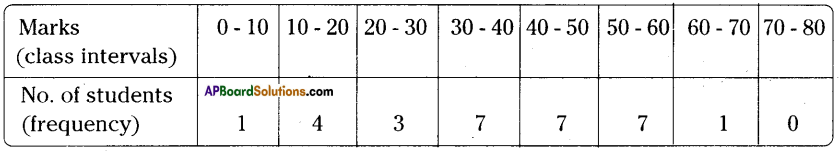
Question 7.
The marks of 30 students of a class, obtained in a test (out of 75), are given below : 42, 21, 50, 37, 42, 37, 38, 42, 49, 52, 38, 53, 57, 47, 29, 59, 61, 33, 17, 17, 39, 44, 42, 39, 14, 7, 27, 19, 54, 51. Form a frequency table with equal class intervals.
(Hint: One of them being 0 – 10)
Solution:
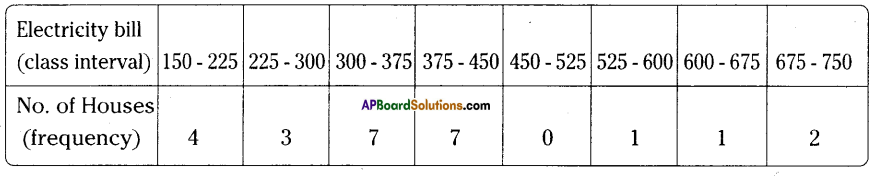
Question 8.
The electricity bill (in rupees) of 25 houses in a locality are given below. Construct a grouped frequency distribution table with a class size of 75.
170, 212, 252, 225, 310, 712, 412, 425, 322, 325, 192, 198, 230, 320, 412, 530, 602, 724, 370, 402, 317, 403, 405, 372, 413.
Solution:
The least value of observations = 170
The height value of observations = 724
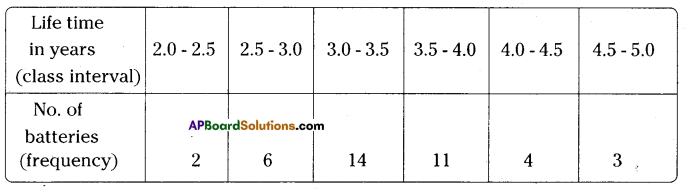
Question 9.
A company manufactures car batteries of a particular type. The life (in years) of 40 batteries were recorded as follows.
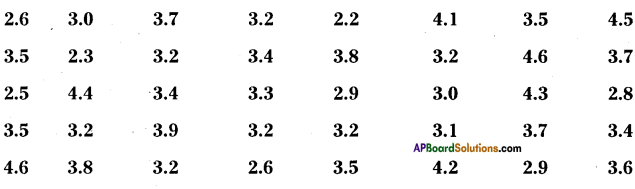
Construct a grouped frequency distribution table with exclusive classes for this data, using class intervals of size 0.5 starting from the interval 2 – 2.5.
Solution: