Practice the AP 8th Class Maths Bits with Answers Chapter 7 Frequency Distribution Tables and Graphs on a regular basis so that you can attempt exams with utmost confidence.
AP State Syllabus 8th Class Maths Bits 7th Lesson Frequency Distribution Tables and Graphs with Answers
Choose the correct answer.
Question 1.
Which of the following are Central Tendency Measure ?
A) A.M.
B) Median
C) Mode
D) All the above
Answer:
D) All the above
Question 2.
Which of the following Central Tendency values is used frequently ?
A) A.M.
B) Median
C) Mode
D) All the above
Answer:
A) A.M.
![]()
Question 3.
The mean of first 10 natural numbers is
A) 55
B) 5.5
C) 4.5
D) 45
Answer:
B) 5.5
Question 4.
The mean of 7 observations is 32. If one observation 48 is added to this then the new mean is
A) 36
B) 32
C) 34
D) 38
Answer:
C) 34
Question 5.
A.M. of 20, 11, 21, 25, 23, 14 is
A) 19
B) 18
C) 17
D) 20
Answer:
A) 19
Question 6.
Which of the following is depend on all the observations ?
A) A.M.
B) Median
C) Mode
D) All the above
Answer:
A) A.M.
Question 7.
Which of the following contains only one value ?
A) A.M.
B) Median
C) Mode
D) All the above
Answer:
A) A.M.
Question 8.
The mean of 9 observations is 45. If 24 is printed wrongly as 42 then the correct mean is
A) 42
B) 44
C) 41
D) 43
Answer:
D) 43
Question 9.
Which of the following is not affected by smallest and largest values of the observations ?
A) A.M.
B) Median
C) Mean
D) None
Answer:
B) Median
![]()
Question 10.
The mode of first 10 natural numbers is
A) 0
B) 1
C) 5.5
D) 5
Answer:
D) 5
Question 11.
 = ……………….
A) Median
B) Frequency
C) Mean
D) None
Answer:
C) Mean
Question 12.
If ‘n’ is odd then median = ………………….
A) \(\frac{\mathbf{n}+1}{2}\)
B) \(\frac{n}{2}\)
C) \(\frac{n-1}{2}\)
D) \(\frac{n}{2}\) + 1
Answer:
A) \(\frac{\mathbf{n}+1}{2}\)
Question 13.
AM (On Deviation Method) = ……………..
A) \(\bar{x}\) = A + \(\frac{\Sigma(\mathrm{xi}-\mathrm{A})}{\mathrm{N}}\)
B) Σfx
C) \(\frac{\Sigma f \mathrm{x}}{\Sigma \mathrm{f}}\)
D) \(\overline{\mathrm{x}}\) = A – \(\frac{\sum \mathbf{x} \mathrm{i}}{\mathbf{N}}\)
Answer:
A) \(\bar{x}\) = A + \(\frac{\Sigma(\mathrm{xi}-\mathrm{A})}{\mathrm{N}}\)
Question 14.
If ‘n’ is even then median is equal to the mean of ……………….
A) \(\frac{n}{2}, \frac{n}{2}\) – 1
B) \(\frac{n}{2}, \frac{n+1}{2}\)
C) \(\frac{n-1}{2}\), n
D) \(\frac{n}{2}\), n + 1
Answer:
B) \(\frac{n}{2}, \frac{n+1}{2}\)
Question 15.
Median of 14, 36, 25, 28, 35, 32, 56, 42, 50 is ……………….
A) 16
B) 53
C) 35
D) 45
Answer:
C) 35
Question 16.
The median of first 10 natural numbers is …………..
A) 5.7
B) 5.5
C) 6.5
D) 3.5
Answer:
B) 5.5
![]()
Question 17.
Mode of 1, 2, 3, 5, 3, 7, 8, 3, 7, 8, 7 is ……………….
A) 8, 1
B) 1, 5
C) 7, 1
D) 3, 7
Answer:
D) 3, 7
Question 18.
The upper boundary of 1 -10 is …………………..
A) 10
B) 11
C) 13
D) 9
Answer:
A) 10
Question 19.
The upper boundary of 1 – 10 in 1 – 10, 11 – 20 is …………………
A) 13.5
B) 10.5
C) 20.5
D) 11.5
Answer:
B) 10.5
Question 20.
Class interval indicates …………………
A) Length
B) Area of rectangle
C) Perimeter
D) None
Answer:
D) None
Question 21.
Classes like 1-10,11-20, 21-30 …………….. are called ………….. classes.
A) Inclusive
B) Exclusive
C) Frequency
D) None
Answer:
A) Inclusive
Question 22.
Classes like 0-10, 10-20, 20-30 ………….. are called classes.
A) Maximum
B) Axis
C) Exclusive
D) Inclusive
Answer:
D) Inclusive
Question 23.
The mid value of 10 – 20 is …………………
A) 10
B) 20
C) 15
D) 16
Answer:
C) 15
![]()
Question 24.
The upper boundary of a class is 20 and its mid value is 15. Then its lower boundary is ………………..
A) 35
B) 20
C) 10
D) 15
Answer:
C) 10
Question 25.
Maximum value – minimum value = ……………….
A) range
B) curve
C) axis
D) limit
Answer:
A) range
Question 26.
The range of first 100 natural numbers is …………………
A) 98
B) 99
C) 109
D) 110
Answer:
B) 99
Question 27.
 = ………………
A) Value
B) Number of classes
C) Items
D) None
Answer:
B) Number of classes
Question 28.
The difference between upper and lower boundaries of class is called ……………..
A) Value
B) Class Interval (C.I.)
C) Frequency
D) None
Answer:
B) Class Interval (C.I.)
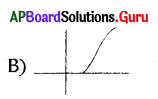
Question 29.
The given figure represents …………………

A) Pie chart
B) Histogram
C) Graph
D) None
Answer:
A) Pie chart
Question 30.
Histogram consists of ………………..
A) Square
B) Rectangles
C) Circles
D) Angles
Answer:
B) Rectangles
Question 31.
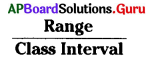
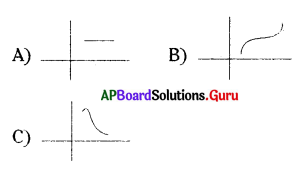
Which of the following graph represents LCF graph ?
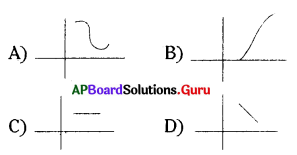
Answer:
Question 32.
Mid value of 24 – 28 is ……………….
A) 13
B) 23
C) 16
D) 26
Answer:
D) 26
![]()
Question 33.
65 is the mid value of ……………….
A) 70-80
B) 60-100
C) 60-70
D) 60-80
Answer:
C) 60-70
Question 34.
Range of 1, 2, 3 …………… 10 = …………..
A) 9
B) 10
C) 8
D) 32
Answer:
A) 9
Question 35.
The given figure represents ……………
A) Pie chart
B) Bar graph
C) Observations
D) None
Answer:
B) Bar graph
Question 36.
How many measures of Central tendencies are there ?
A) 2
B) 31
C) 10
D) 3
Answer:
D) 3
Question 37.
Which is based on all observations ?
A) Mean
B) Median
C) Range
D) None
Answer:
A) Mean
Question 38.
Median of 1, 2, 3 is …………………
A) 1
B) 2
C) 3
D) 10
Answer:
B) 2
Question 39.
Mode of a, b, c, ……………. z is ………………
A) p
B) c
C) z
D) No mode
Answer:
D) No mode
![]()
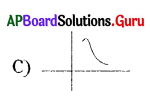
Question 40.
Which of the following graph represents GCF curve ?
D) None
Answer:
Question 41.
Σ xi = 380, N = 10, \(\bar{x}\) = ……………….
A) 16
B) 10
C) 28
D) 38
Answer:
D) 38
Question 42.
Mean of first 10 natural numbers is ………………….
A) 6.5
B) 55
C) 3.5
D) 5.5
Answer:
D) 5.5
Question 43.
Mean of first 5 prime numbers is ………………
A) 6
B) 5
C) 6.5
D) 5.6
Answer:
D) 5.6
Question 44.
Median of 49, 48, 15, 20, 28, 17, 14 and 110 is ………………….
A) 31
B) 92
C) 24
D) 42
Answer:
C) 24
Question 45.
Sum of the central angles in a pie chart is ………………..
A) 360°
B) 300°
C) 110°
D) 60°
Answer:
A) 360°
Question 46.
 | represents ………………….
A) 6
B) 7
C) 8
D) 9
Answer:
A) 6
![]()
Question 47.
Information collected is called …………………
A) Limit
B) Information
C) Range
D) Class Interval
Answer:
B) Information
Question 48.
Range of first 31 natural number is …………………..
A) 10
B) 21
C) 19
D) 30
Answer:
D) 30
Question 49.
The mean of first 6 multiples of 3 is ………………….
A) 19.5
B) 20.5
C) 10.5
D) 10
Answer:
C) 10.5
Question 50.
Mean of a, b, c is ……………..
A) \(\frac{a b c}{3}\)
B) \(\frac{\mathbf{a}+\mathbf{b}+\mathbf{c}}{3}\)
C) \(\frac{a+b}{2}\)
D) \(\frac{a-b-c}{3}\)
Answer:
B) \(\frac{\mathbf{a}+\mathbf{b}+\mathbf{c}}{3}\)
Question 51.
AM of a – 21, a, a + 21 = ………………..
A) a
B) a – 2
C) a + 2
D) 3a
Answer:
A) a
Question 52.
Mean of 12, 13, 18, 17, x, 10, 15 is 15 then x = ………………..
A) 40
B) 31
C) 20
D) None
Answer:
C) 20
Question 53.
AM of x, x+2, x+4, x+6 and x+8 is ………………….
A) x – 1
B) x + 3
C ) x + 2
D) x + 4
Answer:
D) x + 4
![]()
Question 54.
AM of 94, 85, 59, 62, 65, 70, 68, 72 is ……………..
A) 65.7
B) 85.1
C) 71.8
D) 79
Answer:
C) 71.8
Question 55.
Mean of 5, 6, 7, 8, x and 4 is 7 then x = ………………
A) 10
B) 12
C) 13
D) 19
Answer:
B) 12
Question 56.
AM of first 9 natural numbers is ……………….
A) 5
B) 6
C) 10
D) 9
Answer:
A) 5
Question 57.
AM of 8 observations is 30. One observation 30 is deleted from the data then the new mean is ………………….
A) 20
B) 30
C) 10
D) 90
Answer:
B) 30
Question 58.
AM of 6, y, 7, x and 16 is 9 then ………………..
A) x + 2y = 1
B) x – y = 16
C) x + 2y = 0
D) x + y = 16
Answer:
D) x + y = 16
Question 59.
Median of 40, 52, 34, 47, 31, 35, 48, 41, 44, 38 is …………………
A) 16.5
B) 40.5
C) 49.5
D) 50
Answer:
B) 40.5
Question 60.
Median of first 15 odd numbers is ……………
A) 32
B) 10
C) 19
D) 15
Answer:
D) 15
![]()
Question 61.
Mean of 9, 11, 13, k, 18,19 is k then k = ……………….
A) 16
B) 13
C) 14
D) 10
Answer:
C) 14
Question 62.
Mode of 14, 17, 13, 14, 14, 3, 2, 1, 14 is ……………
A) 19
B) 16
C) 24
D) 14
Answer:
D) 14
Question 63.
Median of \(\frac{x}{5}\) x, \(\frac{x}{4}, \frac{x}{2}, \frac{x}{3}\) is 8 (x > 0) then the value of x is = …………
A) 14
B) 33
C) 10
D) 24
Answer:
D) 24
Question 64.
Sum of all deviations taken from AM is …………….
A) 4
B) 3
C) – 1
D ) 0
Answer:
D ) 0
Question 65.
The A.M numbers starting with x + 1 is
A) x + 5.5
B) x – 5.5
C) x + 10
D) x + 5
Answer:
A) x + 5.5
Question 66.
AM of \(\frac{1}{3}, \frac{3}{4}, \frac{5}{6}, \frac{1}{2}, \frac{7}{12}\) is …………….
A) 12
B) \(\frac{3}{5}\)
C) \(\frac{1}{2}\)
D) \(\frac{1}{9}\)
Answer:
B) \(\frac{3}{5}\)
Question 67.
AM of 11 observations is 17.5 and one observation 15 is deleted from the data them the mean of remaining observations is………
A) 17.75
B) 19.85
C) 19.5
D) 18.15
Answer:
A) 17.75
![]()
Question 68.
AM of 8, -2, 9, 6, 13, 17, 12 is …………..
A) 9
B) 10
C) 32
D) 19
Answer:
A) 9
Question 69.
Range of 0, 1, 2, 3 …………… , 9 is …………….
A) 0
B) 9
C ) 12
D) 13
Answer:
B) 9
Question 70.
Median of \(\frac{1}{5}, \frac{1}{2}, \frac{1}{6}, \frac{1}{4}, \frac{1}{3}\) is …………….
A) 1
B) 2
C) 3
D) None
Answer:
D) None
Question 71.
AM of x, 15x, 2x is ……………….
A) 17x
B) 6x
C) 7x
D) 9x
Answer:
B) 6x
Question 72.
Mode of 1, 2, 2, 3, 3, 3 is ……………..
A) 1
B) 2
C) 3
D) None
Answer:
C) 3
Question 73.
AM of 1, 3, 5, 7 …………….. (2n – A) is ………….
A) \(\frac{2 n}{3}\)
B) \(\frac{n}{3}\)
C) n + 1
D) None
Answer:
D) None
Question 74.
Mode of 20, 30,10, 20, 30, 30, 30, 30, 30, 14, 16, 18, 30, 30 is ………………
A) 30
B) 60
C) 39
D) 38
Answer:
A) 30
![]()
Question 75.
AM of -8, -4,+ 4, -3, 1 is …………….
A) – 4
B) – 1
C) 3
D) None
Answer:
D) None
Question 76.
Mean of x, \(\frac{1}{x}\) is m then the mean of x3, \(\frac{1}{x^{3}}\) is …………..
A) M (4m2 – 3)
B) M3 + 3
C) M
D) 3M
Answer:
A) M (4m2 – 3)
Question 77.
AM of first ‘n’ natural numbers is …………..
A) \(\frac{n}{2}\)
B) \(\frac{n+1}{2}\)
C) \(\frac{\mathrm{n}}{2}\) – 1
D) \(\frac{\mathrm{n}}{3}\) – 1
Answer:
B) \(\frac{n+1}{2}\)
Question 78.
Median of 30, 5, 21, 42, 13, 10, 27, 33, 17, 8 …………………
A) 91
B) 19
C) 13
D) 25
Answer:
B) 19
Question 79.
Mode of ………….. 9, 8, 6, 6, 9, 1, 3, 3, 3, 3 is
A) 6
B) 3
C) 1
D) 8
Answer:
B) 3
Question 80.
There are four 20’s in 100 numbers five 40’s, six 30’s and the remaining are 10’s then AM = ………………..
A) 4.6
B) 7.4
C) 8.5
D) 9
Answer:
A) 4.6
Question 81.
Range of 2, 4, 6, …………. 200 is …………….
A) 190
B) 100
C) 100
D) 198
Answer:
D) 198
![]()
Question 82.
AM of 1, 2, 3, 4 is
A) 4
B) 6
C) 9
D) None
Answer:
D) None
Question 83
…………. is known as Father of Statistics.
A) Gole
B) Ronald Fisher
C) Comtor
D) None
Answer:
B) Ronald Fisher
Question 84.
Class Interval is denoted by the letter ………………
A) K
B) C
C) P
D) Σ
Answer:
B) C
Question 85.
In \(\) = A + \(\), A is called ……….
A) Class
B) Table
C) Limit
D) Assumed mean
Answer:
D) Assumed mean
Question 86.
The average lower limit of one class and the upper limit of one preceding class is called as ……………… boundary.
A) Lower
B) Last
C) Class
D) None
Answer:
A) Lower
Question 87.
Median of x, 2x, 4x is 12 then mean is ………………
A) 10
B) 11
C) 12
D) none
Answer:
D) none
Question 88.
In a school all the students weared uniform, from this we observe …………….
A) mode
B) mean
C) median
D) none
Answer:
A) mode
![]()
Question 89.
Sum of 20 items is 100 then the mean is………………
A) 16
B) 30
C) 10
D) 5
Answer:
D) 5
Question 90.
In 1 – 10, 11 – 20, 21 – 30 ………… Upper Boundary of class 11-20 is …………..
A) 20.5
B) 19.5
C) 29
D) 30
Answer:
A) 20.5
Question 91.
![]() | | | | represents ………..
| | | | represents ………..
A) 3
B) 10
C) 13
D) 9
Answer:
D) 9
Question 92.
Mid value of class means ………………
A) Class mark
B) Frequency
C) Average
D) Limit
Answer:
A) Class mark
Question 93.
Lower limit of 5-10 is ……………
A) 10
B) 5
C) 10
D) 20
Answer:
B) 5
Question 94.
Mid value of class 60-100 is …………….
A) 120
B) 100
C) 30
D) 80
Answer:
D) 80
Question 95.
The shape of ogive curve is ……………….
A) S
B) L
C) ⌉
D) P
Answer:
A) S
Question 96.
Histogram consists of ……………..
A) Squares
B) Rectangles
C) Circles
D) None
Answer:
B) Rectangles
Question 97.
An item which occurs most frequently in a data is called …………..
A) Median
B) Mean
C) Range
D) Mode
Answer:
D) Mode
![]()
Question 98.
Mid values are used in the calculation of ……………
A) Mean
B) Median
C) Range
D) None
Answer:
B) Median
Question 99.
In a data AM of 7 items is 32 and for this data an item 48 is added then the result of AM = …………….
A) 70
B) 40
C) 34
D) 43
Answer:
C) 34
Question 100.
Which of the following is not a measures of central tendency ?
A) AM
B) Median
C) Mode
D) Range
Answer:
D) Range