Practice the AP 7th Class Maths Bits with Answers 6th Lesson Data Handling on a regular basis so that you can attempt exams with utmost confidence.
AP Board 7th Class Maths Bits 6th Lesson Data Handling
Multiple Choice Questions :
Question 1.
Father of the Indian statistics is ______
(A) C.R. Rao
(B) Sir R.A. Fisher
(C) Ramanujan
(D) Aryabhatta
Answer:
(A) C.R. Rao
Question 2.
Measures of Central Tendency are ______
(A) Mean
(B) Mode
(C) Median
(D) All of the above
Answer:
(D) All of the above
Question 3.
A number or value that represents or shows the central tendency of a group of observations of data is ______
(A) Median
(B) Mode
(C) Arithmetic Mean
(D) None
Answer:
(C) Arithmetic Mean
Question 4.
The difference between maximum and minimum values of data is its ______
(A) Mean
(B) Mode
(C) Median
(D) Range
Answer:
(B) Mode
![]()
Question 5.
The observation which occurs most 13. What is the mean of first 10 natural frequently in the given data is called ______ of the data.
(A) Mean
(B) Mode
(C) Median
(D) None
Answer:
(B) Mode
Question 6.
Data having two modes is known as ______
(A) Unimodal data
(B) Bimodal data
(C) Trimodal data
(D) No mode
Answer:
(B) Bimodal data
Question 7.
The middle most value of the data, when the observations are arranged in either ascending or descending order is called ______
(A) Mean
(B) Mode
(C) Median
(D) None
Answer:
(C) Median
Question 8.
Representation of numerical data by using bars of uniform width is called ______
(A) Bar graph
(B) Pictograph
(C) Pie diagram
(D) None
Answer:
(A) Bar graph
Question 9.
The parts of the circle used to ______
(A) Triangles
(B) Rectangles
(C) Sectors
(D) Bars
Answer:
(C) Sectors
Question 10.
The visual representation of the numerical data by sectors of a circle is ______
(A) Pie chart
(B) Bar graph
(C) Pictograph
(D) None
Answer:
(A) Pie chart
Question 11.
The mean of first five even numbers is
(A) 6
(B) 8
(C) 5
(D) 10
Answer:
(A) 6
Question 12.
The appropriate representative value for the following situation is to know the performance of students in a Maths test is ______
(A) Mode
(B) Median
(C) Mean
(D) All
Answer:
(C) Mean
![]()
Question 13.
What is the mean of first 10 natural numbers?
(A) 5.4
(B) 5.6
(C) 5.3
(D) 5.5
Answer:
(D) 5.5
Question 14.
The mean of 2, 3, 4, 7, 11, x, 9 is 6, then the value of x is ______
(A) 4
(B) 5
(C) 6
(D) 7
Answer:
(C) 6
Question 15.
The median of 1, 2, 0, 3, 7, 5, 2.5 is ______
(A) 2
(B) 2.5
(C) 1
(D) 1.5
Answer:
(B) 2.5
Question 16.
What is the mode of the observations 2, 3, 5, 2, 7, 3, 2, 8, 6?
(A) 5
(B) 3
(C) 2, 5
(D) 2
Answer:
(D) 2
Question 17.
Measure of central tendency involved in preparation of number of sweets for a function is ______
(A) Mean
(B) Median
(C) Mode
(D) None
Answer:
(A) Mean
Question 18.
From different sizeg of Chappals opting a suitable size is ______
(A) Mean
(B) Median
(C) Mode
(D) None
Answer:
(C) Mode
Question 19.
If 1 is added to 3, 4, 5, 5, 8 then the value of its mean is ______
(A) remains same
(B) increases the mode
(C) increases by 1
(D) none
Answer:
(C) increases by 1
Question 20.
What is the difference between the median and mode of the following data? 32, 38, 33, 35, 34, 35, 42
(A) 0
(B) 2
(C) 3
(D) 7
Answer:
(A) 0
![]()
Question 21.
Which of the following is called Bimodal data?
(A) 3, 5, 9, 6, 5, 9, 2, 9, 3, 5
(B) -0, 1, 2, 3, 3, 4, 5, 6, 7, 8
(C) 1, 2, 3, 4, 5, 6, 7, 8, 9, 10
(D) 5, 6, 3, 5, 4, 9, 5, 6, 4, 5
Answer:
(A) 3, 5, 9, 6, 5, 9, 2, 9, 3, 5
Question 22.
In a class of 10th students dullers-6, average-6, above average-8, brilliant- 4. From the above figure the angle for brilliant students is ______
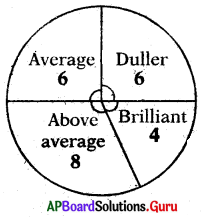
(A) 45°
(B) 60°
(C) 90°
(D) 30°
Answer:
(B) 60°
Question 23.
From the above figure, dullers represents the angle of ______
(A) 120°
(B) 80°
(C) 150°
(D) 90°
Answer:
(D) 90°
Question 24.
From the above figure, Above average represents the angle of ______
(A) 120°
(B) 110°
(C) 450°
(D) 90°
Answer:
(A) 120°
Question 25.
\(\frac{\text { Sum of observations }}{\text { Number of observations }}\) = ______
(A) Mode
(B) Median
(C) Mean
(D) Range
Answer:
(C) Mean
Reasoning Questions:
Question 1.
C, G, K, O, S, V, ______
(A) Z
(B) W
(C) X
(D) A.
Answer:
(D) A.
Question 2.
ZB, YD, XF WH ______
(A) VJ
(B) VI
(C) UJ
(D) UI
Answer:
(A) VJ
![]()
Question 3.
DCBA, STUV, HGFE, WXYZ ______
(A) KIMN
(B) LKJI
(C) JKLM
(D) LMNU
Answer:
(B) LKJI
Question 4.
Z, YX, WVU, TSRQ, ______
(A) IMNOP
(B) ONMLK
(C) PONML
(D) MNOPQ
Answer:
(C) PONML
Question 5.
SV ZAY, XBW, VCU, TDS, ______
(A) PER
(B) QER
(C) REP
(D) REQ
Answer:
(D) REQ
Question 6.
ABP, CDQ, EFR, GHS, ______
(A) IJT
(B) JKT
(C) UU
(D) JKU
Answer:
(A) IJT
Question 7.
PO, QP, RQ, SR, ______
(A) ST
(B) TS
(C) UT
(D) TU
Answer:
(B) TS
Question 8.
ZM>YN, XO, WP ______
(A) VO
(B) VQ
(C) VR
(D) RV
Answer:
(B) VQ
Question 9.
EV, GT, IR, KP, ______
(A) MN
(B) LM
(C) NM
(D) ML
Answer:
(A) MN
Question 10.
MNM, NLK, OJI, PHG ______
(A) EOF
(B) FQE
(C) QFE
(D) GQH
Answer:
(C) QFE
Fill in the blanks :
Question 1.
Father of the Statistics was ______
Answer:
Sir R.A. Fisher
Question 2.
Types of measure of central tendency are ______
Answer:
3
Question 3.
Arithmetic Mean (Average) = ______
Answer:
\(\frac{\text { Sum of observations }}{\text { Number of observations }}\)
Question 4.
Arithmetic mean of given data always lies between the ______ and ______ observations of the data.
Answer:
Highest and lowest
![]()
Question 5.
Data having only one mode is known as ______
Answer:
Unimodal data
Question 6.
If the number of observations is odd the median is ______
Answer:
\(\left(\frac{\mathrm{n}+1}{2}\right)^{\mathrm{th}}\) Observation
Question 7.
If number of observations is even, then the median ______
Answer:
Average of \(\left(\frac{\mathrm{n}}{2}\right)^{\text {th }}\) and \(\left(\frac{n}{2}+1\right)^{\text {th }}\) obervations
Question 8.
Data represented in the form of picture, graphs or chats is ______
Answer:
Viaual representation
Question 9.
In bar graphs the width of all rectangles (bars) is ______
Answer:
equal
Question 10.
In bargraphs the height (length) of each bar is ______ to the data that it represents.
Answer:
Proportional
Question 11.
Angle of the sector = ______
Answer:
\(\frac{\text { Value of the item }}{\text { Sum of the value of all items }}\) × 360°
Question 12.
The mean of first six odd numbers is ______
Answer:
6
Question 13.
The mode of 1, 2, 2, 3, 3, 4, 4, 4 is ______
Answer:
4
Question 14.
The median of 2, 3, 5, 2, 3, 6, 2, 4, 8 is ______
Answer:
3
Question 15.
What is the average temperature of Rentachintala in the month of May for 5 days 47°C, 46.5°C, 44.5°C, 48°C, 44°C? ______
Answer:
46°C
Question 16.
The mean of first 7 primes is ______
Answer:
28
Question 17.
What is the mean of 2 – a, 2, 2 + a ? ______
Answer:
2
Question 18.
What is the median of 7, 2, 11, 3, 5, 13, 17 ? ______
Answer:
7
Question 19.
The mode of first 10 natural numbers is ______
Answer:
No mode
Question 20.
If a fixed number is added to the given observation, then the change of the median is ______
Answer:
Increase the median in addition to the fixed number
Question 21.
Wages of workers in a factory taken into consideration is ______
Answer:
Median
Question 22.
In a class test Sreeja and Sreekari got 18 each. Aditya and Swathi got 16 each and Sonali got 17, then their average mark is ______
Answer:
17
Question 23.
A data of 10 observations has a minimum value 15 and maximum value 25, then the mean of the data is always ______
Answer:
Always between 15 and 25
![]()
Question 24.
The mode of the data 2, 3, 5, 9, 6, 5, 9, 3, 5, 9 is ______
Answer:
Both 5 and 9
Question 25.
The median of 49, 48, 15, 20, 28, 17, 14 and 110 is ______
Answer:
24
Match the following :
Question 1.
| 1. Mean of 1, 2, 3, 4, 5, 6 is | (A) No mode |
| 2. Mode of 1, 2, 3, 4, 5, 6 is | (B) 5 |
| 3. Median of 1, 2, 3, 4, 5, 6, 7 is | (C) 3.5 |
| 4. Range of 1, 2, 3, 4, 5, 6 is | (D) 3 |
| 5. Types of measure of central tendency are | (E) 4 |
Answer:
| 1. Mean of 1, 2, 3, 4, 5, 6 is | (C) 3.5 |
| 2. Mode of 1, 2, 3, 4, 5, 6 is | (A) No mode |
| 3. Median of 1, 2, 3, 4, 5, 6, 7 is | (E) 4 |
| 4. Range of 1, 2, 3, 4, 5, 6 is | (B) 5 |
| 5. Types of measure of central tendency are | (D) 3 |
Question 2.
| 1. \(\frac{\text { Sum of observations }}{\text { Number of observations }}\) = ______ | (A) Mode |
| 2. The middle most yalue of the data when the data is arranged in the ascending order | (B) Rang |
| 3. The most frequently observation occured in the data is ______ | (C) Median |
| 4. Difference of maximum value and minimum value is ______ | (D) Mean |
Answer:
| 1. \(\frac{\text { Sum of observations }}{\text { Number of observations }}\) = ______ | (D) Mean |
| 2. The middle most yalue of the data when the data is arranged in the ascending order | (C) Median |
| 3. The most frequently observation occured in the data is ______ | (A) Mode |
| 4. Difference of maximum value and minimum value is ______ | (B) Rang |