AP State Board Syllabus AP SSC 10th Class Maths Textbook Solutions Chapter 14 Statistics Ex 14.4 Textbook Questions and Answers.
AP State Syllabus SSC 10th Class Maths Solutions 14th Lesson Statistics Exercise 14.4
10th Class Maths 14th Lesson Statistics Ex 14.4 Textbook Questions and Answers
Question 1.
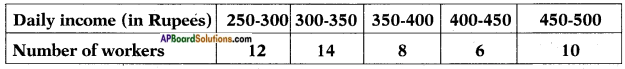
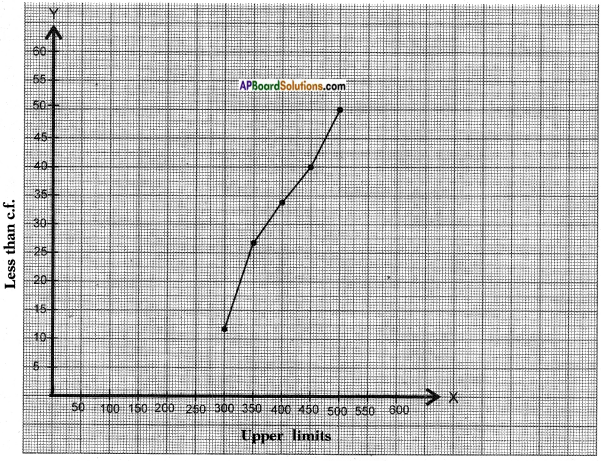
The following distribution gives the daily income of 50 workers of a factory.
Convert the distribution above to a less than type cumulative frequency distribution, and draw its ogive.
Answer:
Since the curve is a less than type graph the data changes to
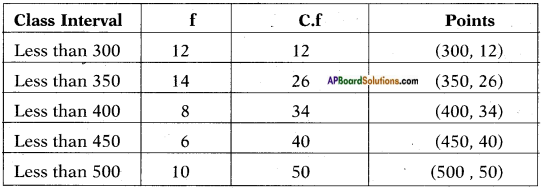
X – axis – upper limits 1 cm = 50 units.
Y – axis – less than c.f. 1 cm = 5 units.
![]()
Question 2.
During the medical check-up of 35 students of a class, their weights were recorded as follows:
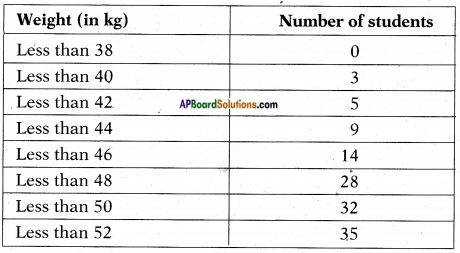
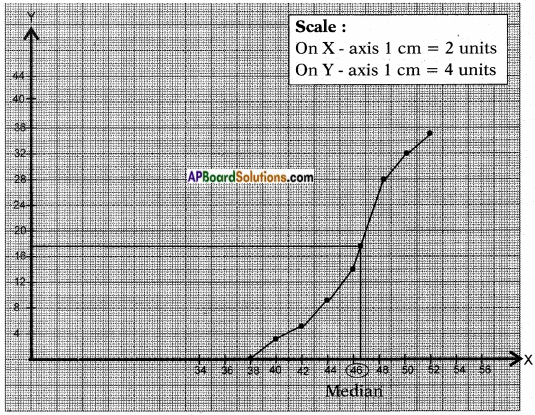
Draw a less than type ogive for the given data. Hence obtain the median weight from the graph and verify the result by using the formula.
Answer:
Given: Upper limits of the classes and less than cumulative frequencies. Therefore required points are (38, 0), (40, 3), (42, 5), (44, 9), (46, 14), (48, 28), (50, 32) and (52, 35)
X – axis – upper limits 1 cm = 2 units.
Y – axis – less than c.f. 1 cm = 4 units.
![]()
Number of observations = 35
∴ \(\frac{N}{2}\) = \(\frac{35}{2}\) = 17.5
Locate the point on the ogive whose ordinate is 17.5.
The x – coordinate of this point is the required median.
From the graph, median = 46.5.
Number of observations = n = 35
∴ \(\frac{N}{2}\) = \(\frac{35}{2}\) = 17.5
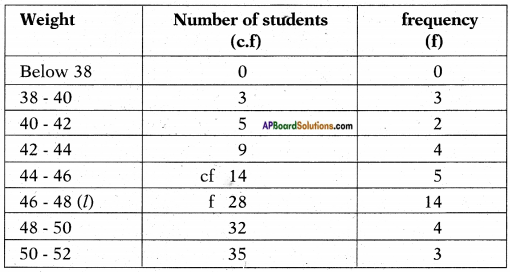
17.5 belongs to the class 46 – 48
∴ Median class = 46-48
l – lower boundary of class = 46
f – frequency of the median class =14
c.f = 14
Class size = 2
Median = \(l+\frac{\left[\frac{\mathrm{n}}{2}-\mathrm{cf}\right]}{\mathrm{f}} \times \mathrm{h}\)
= 46 + \(\frac{17.5-14}{14}\) × 2
= 46 + \(\frac{3.5}{14}\) × 2
= 46 + \(\frac{7}{14}\)
= 46 + \(\frac{1}{2}\)
= 46.5
Here median is 46.5 by either by ways.
![]()
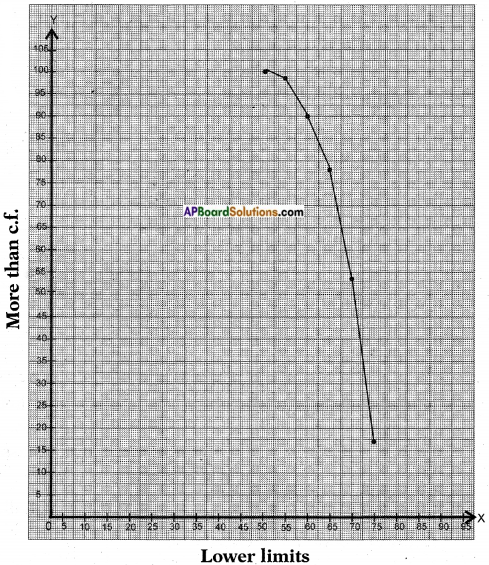
Question 3.
The following table gives production yield per hectare of wheat of 100 farms of a village.
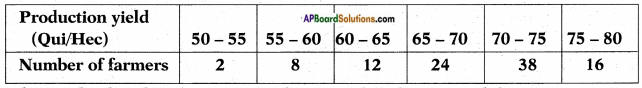
Change the distribution to a more than type distribution, and draw its ogive.
Answer:
The given data is to be changed to more than frequency distribution type.
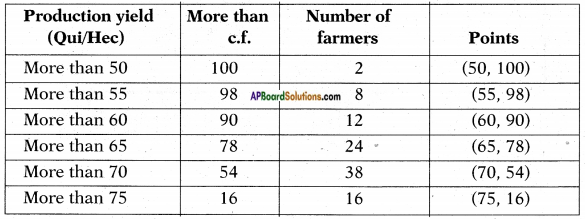
A graph is plotted by taking the lower limits on the X – axis and respective of Y – axis.
Scale:
X – axis: 1 cm = 5 units
Y – axis: 1 cm = 5 units