Andhra Pradesh BIEAP AP Inter 1st Year Economics Study Material 10th Lesson Economic Statistics Textbook Questions and Answers.
AP Inter 1st Year Economics Study Material 10th Lesson Economic Statistics
Essay Questions
Question 1.
What is the relationship between Economics and Statistics? [March 18, 16]
Answer:
There is a close relationship between statistics and economics. In the words of Tugwell “The science of economics is becoming statistical in its method”. All economic laws are pronounced on the basis of statistical facts and figures. The theory of the population of Malthus, the law of family expenditure of Engels, etc., were propounded after statistical tests. Statistics help economics to become an exact science.
In the study of theoretical economics, the application and use of statistical methods are of great importance. Most of the doctrines of economics are based on the study of a large number of units and their analysis. This is done through statistical methods. The Law of demand was formulated because of statistical methods.
The importance of statistics is felt in all branches of knowledge- in accountancy and auditing in banking, in insurance in research, and many fields. Without statistics no branch of knowledge is complete.
![]()
Question 2.
Explain the Geometric diagrams. What are Bar diagrams and Pie diagrams ?
Answer:
Diagrams are more suitable to illustrate the data which is discrete, while continuous data is better represented by graphs.
BAR DIAGRAM and PIE DIAGRAM come in the category of geometric diagrams.
The bar diagram are 3 types. Simple, Multiple and Component bar diagrams.
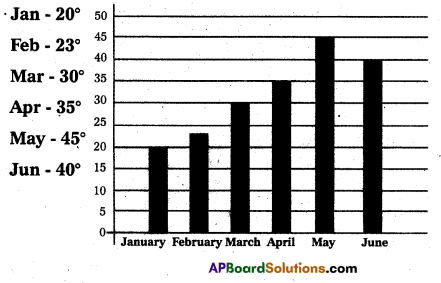
Simple Bar Diagrams : Bar diagrams are very commonly used and is better for representation of quantitative data. Bars are simply
corresponding numerical values.
Ex: Maximum temperature recorded in Hyderabad in the 1st six months in a year in a bar diagram.
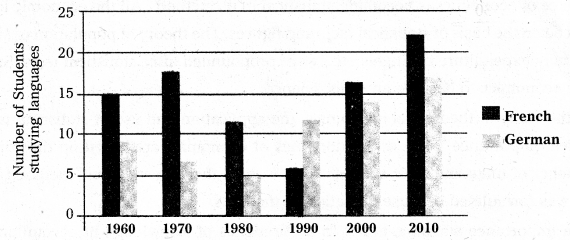
Multiple Bar Diagram : Multiple bar diagrams are used for comparing two or more sets of data.
Ex : The multiple bar diagram depicts the number of students in a college studying two foreign languages, French and German for the period 1960 – 2010 is given below.
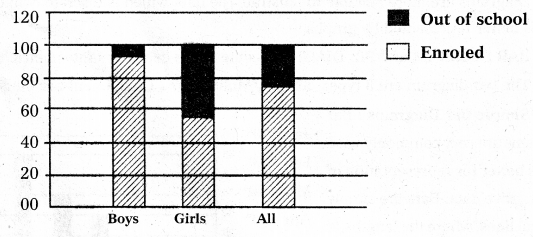
Component Bar Diagram : Component bar diagram charts also called sub-divided bar diagram, are very useful in comparing the sizes of different component parts.
Ex : Enrolment at primary level in a district of Bihar. Boys, girls and total children in the given age group are denoted in the component bar diagram is given below.
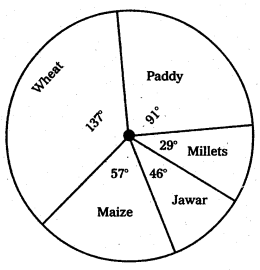
Pie – Diagram : This diagram enables us to show the partitioning of total into component parts. It is also called a pie chart.
Ex : Draw the pie digram for following data.

Total area = 16 + 24 + 10 + 8 + 5 = 63
Area changed into Degrees =
Paddy =\(\frac{16 \times 360}{63}\) = 91°
Wheat = \(\frac{24 \times 360}{63}\) = 137°
Maize = \(\frac{10 \times 360}{63}\) = 57°
Jower = \(\frac{8 \times 360}{63}\) = 46°
Millets = \(\frac{5 \times 360}{63}\) = 29°
Total = 360°
Question 3.
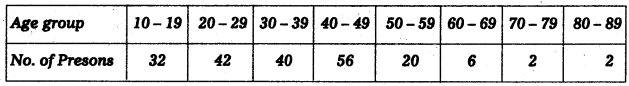
Calculate the AM in direct method of the following data.
Answer:
\(\overline{\mathrm{X}}=\frac{\Sigma \mathrm{fx}}{\mathrm{N}}\)
Where N is total frequency
Σfx = 7160; N = 200
\(\overline{\mathrm{X}}\) = \(\frac{7160}{200}\) = 35.8
∴ \(\overline{\mathrm{X}}\) = 35.8
![]()
Question 4.
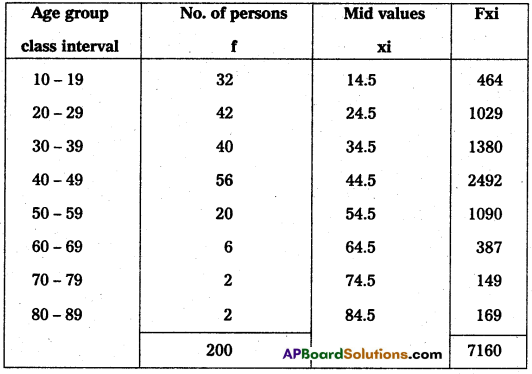
Calculate the A.M. in Direct method.
Answer:
\(\overline{\mathrm{X}}=\frac{\Sigma \mathrm{fx}}{\mathrm{N}}\)
\(\overline{\mathrm{X}}\) = \(\frac{3300}{100}\) = 33
∴ \(\overline{\mathrm{X}}\) = 33
Question 5.
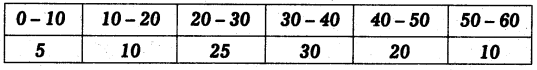
Calculate the A.M. in Deviation method or Shortcut method.
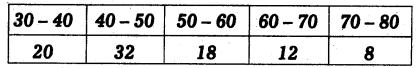
Answer:
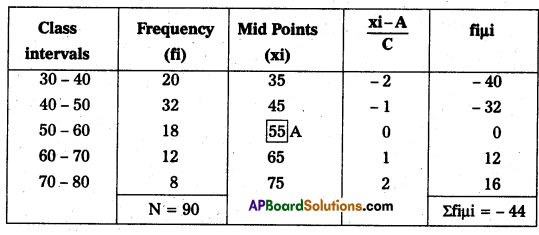
Here class interval (C) = 10
Assumed mean = 55
A.M. (or) \(\overline{\mathrm{X}}\) = A + \(\frac{1}{N}\) Σfiμi × C
= 55 + \(\frac{1}{90}\) (-44) × 10
= 55 + (-4.8)
∴ \(\overline{\mathrm{X}}\) = 50.2
![]()
Question 6.
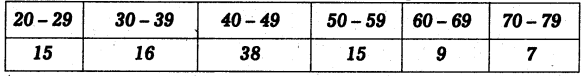
Answer:
Calculation of Mean :
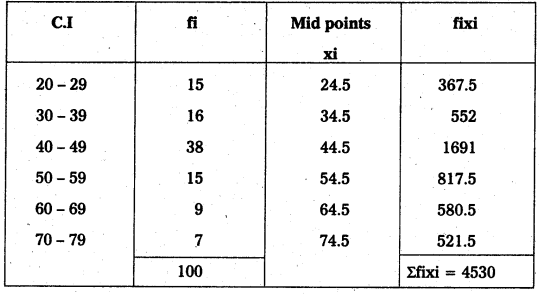
\(\overline{\mathrm{X}}\) = \(\frac{\Sigma \text { fixi }}{\mathrm{N}}=\frac{4530}{100}\) = 45.3
∴ \(\overline{\mathrm{X}}\) = 45.3
Calculation of Median :
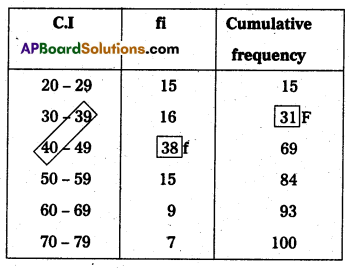
Here N = 100; \(\frac{\mathrm{N}}{2}\) = \(\frac{100}{2}\) = 50
50th value included in the cumulative frequency 40-49 class intervals. But here class intervals are unequal. So we can adjust that lower limit is \(\frac{39+40}{2}=\frac{79}{2}\) = 39.5.
F = 31; f = 38, C = 10
Median = L + \(\left[\frac{\frac{N}{2}-F}{f}\right]\) × C
Median = 39.5 + \(\left[\frac{50-31}{38}\right]\) × 10
= 39.5 + \(\left[\frac{19}{38}\right]\) × 10
= 39.5 + 0.5 × 10
= 39.5 + 5
= 44.5
∴ Median = 44.5
Calculation of Mode:
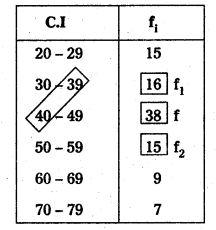
Here the maximum frequency occurs in 40 – 49 class.
f = 38; f1 = 16; f2 = 15; C = 10
L = \(\frac{39+40}{2}=\frac{79}{2}\) = 39.5 (Lower boundary of the model class)
Mode = L + \(\left[\frac{f-f_1}{2 f-f_1+f_2}\right]\) × C
= 39.5 + \(\left[\frac{38-16}{2(38)-(16+15)}\right]\) × 10
= 39.5 + \(\left[\frac{22}{76-31}\right]\) × 10
= 39.5 + 0.48 × 10
= 39.5 + 4.5
Mode = 44.38
Short Answer Questions
Solve the problems for the following datas.
Question 1.
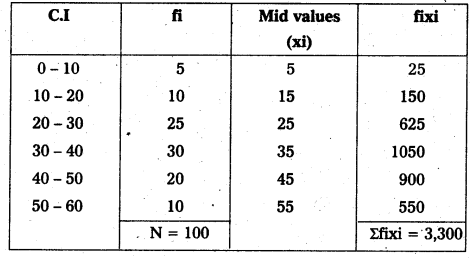
Calculate the Median for the following data.
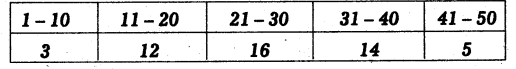
Answer:
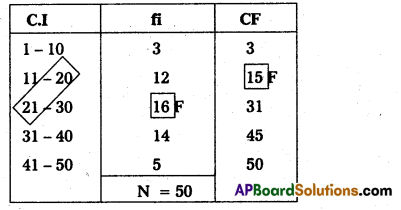
Here N = 100 ; \(\frac{\mathrm{N}}{2}=\frac{50}{2}\) = 25
25th value included in the cumulative frequency 21-30 class intervals.
Lower limit = \(\frac{20+21}{2}=\frac{41}{2}\) = 20.5
F = 15; f = 16; C = 10 N
Median = L + \(\left[\frac{\frac{N}{2}-F}{f}\right]\) × C
Median = 20.5 + \(\left(\frac{25-15}{16}\right)\) × 10
= 20.5 + \(\left(\frac{10}{16}\right)\) × 10
= 20.5 + 0.62 × 10
= 20.5 + 6.25 = 26.75
Median = 26.75
![]()
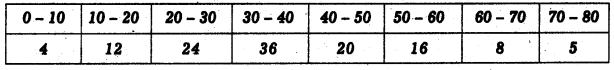
Question 2.
Calculate the Median for the following data.
Answer:
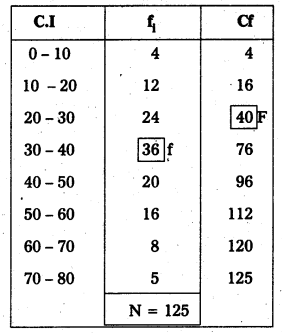
Here N = 125 ; \(\frac{\mathrm{N}}{2}=\frac{125}{2}\) = 62.5
65th value included in the cumulative frequency 7.6
Therefore 30 – 40 in the median class
65th value appears in 30 – 40 class.
Lower limit = 30; F = 40; f = 36; C = 10 N
Median = L + \(\left[\frac{\frac{N}{2}-F}{f}\right]\) × C
Median = 30 + \(\left(\frac{62.5-40}{36}\right)\) × 10
= 30 + \(\left(\frac{22.5}{36}\right)\) × 10
= 30 + 0.625 × 10
= 30 + 6.25
= 36.25
![]()
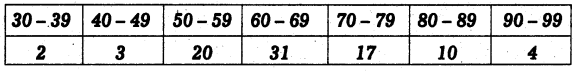
Question 3.
Calculate the Mode for the following data.
Answer:
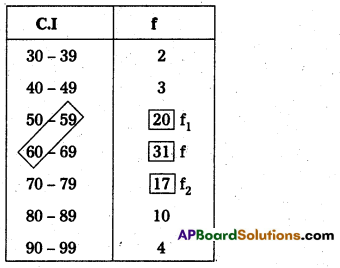
Here the maximum frequency occurs in 59 – 60 class.
L = \(\frac{59+60}{2}=\frac{119}{2}\) = 59.5
f = 31, f1 = 20; f2 = 17; C = 10
Mode = L + \(\left[\frac{f-f_1}{2(f)-\left(f_1+f_2\right)}\right]\) × C
= 59.5 + \(\left[\frac{31-20}{2(31)-20+17}\right]\) × 10
= 59.5 + \(\left(\frac{11}{62-37}\right)\) × 10
= 59.5 + \(\left(\frac{11}{25}\right)\) × 10
= 59.5 + 0.44 × 10
= 59.5 + 4.4
= 63.9
Additional Questions
Question 4.
Marks of 10 students 43, 45, 68, 55, 33, 57, 40, 48, 77, 60. Calculate A.M by direct method.
Answer:
\(\overline{\mathrm{X}}=\frac{\Sigma \mathrm{x}}{\mathrm{N}}\)
Where Σx = 526 ; N = 10
∴ \(\overline{\mathrm{X}}\) = 52.6
Question 5.
Calculate A.M from the following data by direct method.
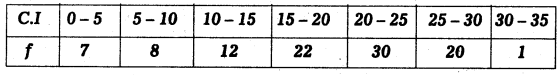
Answer:
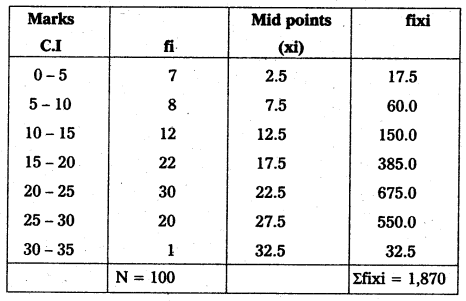
\(\overline{\mathrm{X}}=\frac{\Sigma \text { fixi }}{\mathrm{N}}\) (or) \(\frac{\Sigma \mathrm{fx}}{\mathrm{n}}\)
where = Σfixi = 1870; N = 100
\(\overline{\mathrm{X}}=\frac{1870}{100}\) = 18.7
![]()
Question 6.
Find Median from the following data.
10, 15, 18, 21, 25, 30, 35
Answer:
Arrange asscending order
10, 15, 48, 21, 25, 30, 35
Median = \(\left(\frac{N+1}{2}\right)^{\text {th }}\) item
= \(\left(\frac{7+1}{2}\right)^{\text {th }}\) item = \(\left(\frac{8}{2}\right)^{\text {th }}\) item = 4th item
4th item = 21
∴ Median = 21
Question 7.
Find median from the following data.
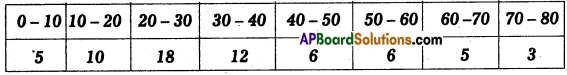
Answer:
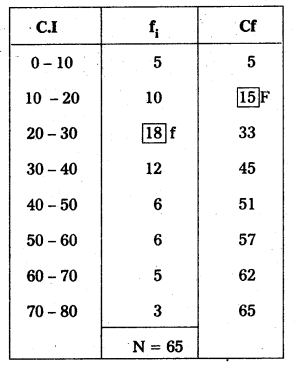
Where \(\) = 32.5 it lies in the 20 – 30 class interval.
So lower limit = 20; F = 15; f = 18; N = 65; C = 10
Median = L + \(\left[\frac{\frac{N}{2}-F}{f}\right]\) × C
= 20 + \(\left[\frac{32.5-15}{18}\right]\) × 10
= 20 + 9.722 = 29.72
∴ Median = 29.72
![]()
Question 8.
Find the mode when median is 125.6 and mean is 128
Answer:
Mode = 3 Median – 2 Mean
= (3 × 125.6) – (2 × 128)
= 376.8 – 256
= 120.8
Very Short Answer Questions
Question 1.
What is meant by Arithmetic Mean ? [March 16]
Answer:
Arithmetic Mean of a statistical data is defined as the quotient of the sum of all, the items or entries divided by the number of items.
Question 2.
Find the A.M. for the data 30, 20, 32, 16, 27. [March 18, 17, 16]
Answer:
\(\overline{\mathrm{X}}=\frac{\Sigma \mathrm{x}}{\mathrm{N}}=\frac{30+20+32+16+27}{5}=\frac{125}{5}\) = 25
∴ \(\overline{\mathrm{X}}\) = 25
Question 3.
Find the Median for the data 10, 20, 15, 29, 35, 42.
Answer:
The values arranged in ascending order
(i.e,) 10, 15, 20, 29, 35, 42
Median = \(\left(\frac{n+1}{2}\right)^{\text {th }}\) item
= \(\left(\frac{6+1}{2}\right)^{\text {th }}\) item
= \(\left(\frac{7}{2}\right)^{\text {th }}\) item = 3.5th item
= \(\frac{20+29}{2}\) = 24.5
Question 4.
Find the value of Median for the data 19, 1, 3, 17, 6, 12, 11, 8.
Answer:
The values arranged in ascending order
i.e., 1, 3, 6, 8, 11, 12, 17, 19
Median = \(\left(\frac{n+1}{2}\right)^{\text {th }}\) item
= \(\left(\frac{8+1}{2}\right)^{\text {th }}\) item
= \(\left(\frac{9}{2}\right)^{\text {th }}\) item = 4.5th value
= \(\frac{8+11}{2}=\frac{19}{2}\) = 9.5
∴ Median = 9.5
![]()
Question 5.
Find the Mode for the data 17, 6, 19, 14, 8, 6, 12, 15, 6, 10.
Answer:
Mode is 6 is occuring many items i.e., 3
Question 6.
Find the Mode for the data 12, 11, 15, 11, 12 ,12, 15, 12, 9, 12. [March 18]
Answer:
Mode is 12 is occuring many items i.e 5
Question 7.
What is a Pie diagram ? [March 18, 17, 16]
Answer:
It is also called a pie chart. The circle is divided into many parts as there are compo-nents by drawing straight lines from the centre to the circumference.
Question 8.
What is a Bar diagram ?
Answer:
Bars are simply vertical lines, where the lengths of bars are proportional to their corresponding numerical values.
Question 9.
Find the median of the observation – 3,- 5, -8, 0, 2, -10,
Answer:
Arrange data in ascending order – 10, – 8, – 5, – 3, 0, 2
Median = \(\left(\frac{n+1}{2}\right)^{\text {th }}\) item
= \(\left(\frac{6+1}{2}\right)^{\text {th }}\) item
= \(\left(\frac{7}{2}\right)^{\text {th }}\) item = 3.5
= \(\frac{-5+(-3)}{2}=\frac{-8}{2}\) = -4
∴ Median = – 4
Additional Questions
Question 10.
What is mode if data is Bio-modal?
Answer:
Mode = 3 Median – 2 Mean
![]()
Question 11.
What is Median ?
Answer:
The median is a measure of central tendency, which appears in the centre of an ordered data. It is aften described as the “middle most” value. It is called a position average.
Question 12.
What is Mode?
Answer:
Mode is most frequently occuring value in data.
Question 13.
What is Simple Bar Diagram ?
Answer:
Bar diagram comprising a group of equi-spaced and equi-width rectangular bars for each class of data.
Question 14.
What is Multiple Bar Diagrams ?
Answer:
Multiple bar diagrams are used for comparing two or more set of data.
Question 15.
What is Component Bar Diagram or Sub-Divided Bar Diagram ?
Answer:
These diagrams are used to represent various parts of the total.