AP State Syllabus AP Board 8th Class Maths Solutions Chapter 7 Frequency Distribution Tables and Graphs Ex 7.1 Textbook Questions and Answers.
AP State Syllabus 8th Class Maths Solutions 7th Lesson Frequency Distribution Tables and Graphs Exercise 7.1
![]()
Question 1.
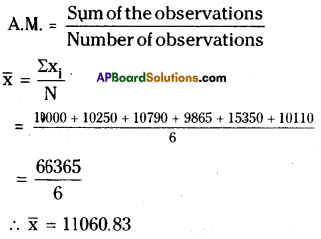
Find the arithmetic mean of the sales per day in a fair price shop in a week.
₹ 10000, ₹ 10250, ₹ 10790, ₹ 9865, ₹ 15350, ₹ 10110
Solution:
Question 2.
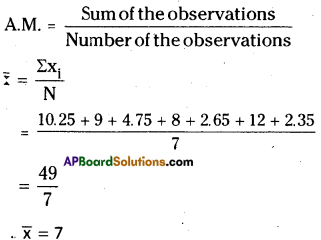
Find the mean ofthe data; 10.25, 9, 4.75, 8, 2.65, 12, 2.35
Solution:
![]()
Question 3.
Mean of eight observations is 25. If one observation 11 is excluded, find the mean of the remaining.
Solution:
Given that
The mean of 8 observations = 25
The sum of 8 observations = 8 × 25
= 200
If the observation 11 is subtracted from the sum
⇒ 200 – 11 = 189
∴ The mean of remaining 7 observations = \(\frac { 189 }{ 7 }\) = 27
Question 4.
Arithmetic mean of nine observations is calculated as 38. But in doing so, an observation 27 is mistaken for 72. Find the actual mean of the data.
Solution:
The mean of 9 observations = 38
The sum of 9 observations = 38 × 9
= 342
If the observation 27 is mistaken for 72
then correct observation = 72 – 27
= 45
Sum of correct observations = 342 + 45
= 387
∴ Correct Mean = \(\frac { 387 }{ 9 }\) = 43
![]()
Question 5.
Five years ago mean age of a family was 25 years. What is the present mean age of the family ?
Solution:
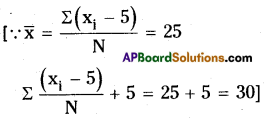
When all the observations of the data are increased or decreased by a certain number, the mean also increases or decreases by the same number.
Five years ago mean age of a family = 25 years
Present mean age of the family = 25 + 5 = 30 y
Question 6.
Two years ago the mean age of 40 people was 11 years. Now a person left the group and the mean age is changed to 12 years. Find the age of the person who left the group.
Solution:
The present mean age of 40 people = 11 + 2 = 13 years
∴ The total age of 40 people = 40 × 13
= 520 years
If 1 person is left from the group of 40 people then remaining will be = 40 – 1 = 39.
The mean age of 39 people = 12 years
The total age of 39 people = 39 × 12
= 468 years
Age of the person who left from the group = 520 – 468 = 52 years
Question 7.
Find the sum of deviations of all observations of the data 5,8, 10, 15,22 from their mean.
Solution:
A.M. of the observations 5,8,10,15,22 is
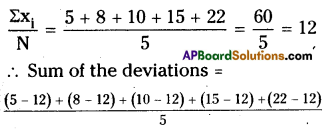
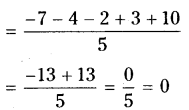
∴ Sum of deviations = 0
![]()
Question 8.
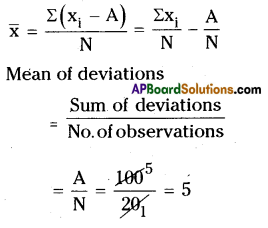
If sum of the 20 deviations from the mean is 100, then find the mean deviation.
Solution:
Question 9.
Marks of 12 students inaunittestare givenas4,21, 13, 17,5,9, 10,20, 19, 12,20, 14.
Assume a mean and calculate the arithmetic mean of the data. Assume another number as
mean and calculate the arithmetic mean again. Do you get the same result? Comment.
Solution:
Given observations are 4, 21, 13, 17, 5, 9, 10, 20, 19, 12, 20, 14
Estimated mean = 10 say
A.M. Estimated Mean + Average of deviations
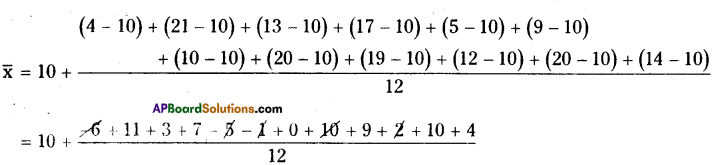
= 10 + \(\frac { 44 }{ 12 }\) = 10 + 3.67 = 13.67
∴ A.M = \(\bar{x}\) = 13.67
Another Estimated Mean = 12 then
\(\bar{x}\) = A.M. = Estimated Mean + Average of deviations
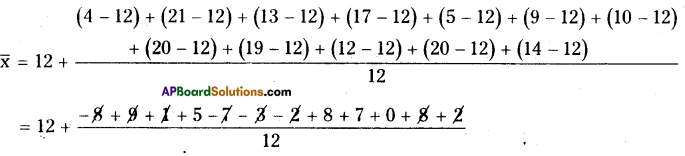
= 12 + \(\frac { 20 }{ 12 }\) = 12 + 1.67 = 13.67
\(\bar{x}\) = 13.67
∴ In all cases \(\bar{x}\) = 13.67
![]()
Question 10.
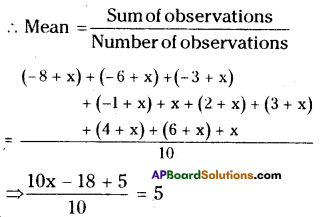
Arithmetic mean of marks (out of 25) scored by 10 students was 15. One of the student, named Karishma enquired the other 9 students and find the deviations from her marks are noted as – 8, – 6, – 3, – 1, 0, 2, 3,4, 6. Find Karishma’s marks.
Solution:
Average marks of 10 students = 15
Total marks of 10 students = 10 × 15
= 150
Marks obtained by Karishma = x say
Deviations of 9 students =
-8, -6-3,-1,0, 2, 3,4,6
∴ x-8 + x-6 + x-3 + x-l + x + x + 2 + x + 3 + x + 4 + x + 6 + x = 150
⇒ 10x- 3 = 150
⇒ 10x = 150 + 3 = 153
x = \(\frac { 153 }{ 10 }\) = 15.3
(Or)
The given observations are
-8,-6,-3,-1,0, 2, 3, 4,6
Let the number of marks of Karisima =
Her deviation from x’ are – 8 + x, – 6 + x, – 3 + x, – 1 + x, x + 0, 2 + x, 3 + x, 4 + x, 6 + x
[ ∵ Mean = 15 is given]
10x – 3 = 15 × 10
10x =150 + 3
10x= 153
x = \(\frac{153}{10}\)
x = 15.3
∴ Number of marks obtained by Karishma = 15.3
![]()
Question 11.
The sum of deviations of ‘n’ observations from 25 is 25 and sum of deviations of the same ‘n’ observations from 35 is – 25. Find the mean of the observations.
Solution:
From the value ’25’ the sum of deviations of a data = Σx1 = 25
∴ Mean of the observation = 25 + \(\frac{\Sigma \mathrm{x}_{1}}{\mathrm{n}}\)
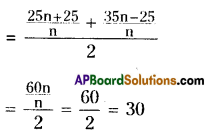
= \(25+\frac{25}{n}=\frac{25 n+25}{n}\)
From the value ’35’ the sum of deviations of a data = Σx1 = -25
∴ Mean of the observation = 35 + \(\frac{\Sigma \mathrm{x}_{1}}{\mathrm{n}}\)
= \(35+\frac{-25}{n}=\frac{35 n+25}{n}\)
Mean of the given data
(Or)
Let x1, x2, x3,…… xn are the number of
deviations from 25
∴ Number of observations are
x1 – 25, x2 – 25, …………. xn – 25
∴ Sum of the observations = 25
∴ x1 – 25 + x2 – 25 +…………. + xn – 25 = 25
⇒ x1+ x2 + + xn = 25 + 25n …………(1)
= 25 (n + 1)
Deviations from 35 are
x1 – 35, x2 – 35y …………., xn – 35
∴ Sum of the deviations = – 25
∴ (x1 – 35) + (x2 – 35) + … (xn – 35) = – 25
⇒x1 + x1 +………………….. + xn = – 25 + 35 x n …………….(2)
From (1) and (2),
– 25 + 35n = 25 + 25n
⇒ 10n = 50
n = 5
∴ Mean of the observations
![]()
Question 12.
Find the median of the data ; 3.3, 3.5, 3.1, 3.7, 3.2, 3.8
Solution:
The ascending order of 3.3, 3.5, 3.1, 3.7, 3.2, 3.8 is 3.1, 3.2, 3.3, 3.5, 3.7, 3.8
∴ n = 6 (is an even)
Median = Mean of \(\frac{n}{2},\left(\frac{n}{2}+1\right)\) terms
= \(\frac{6}{2}, ([latex]\frac{6}{2}\) + 1)[/latex]
= Mean of 3, 4 terms
= \(\frac{3.3+3.5}{2}\)
= \(\frac{6.8}{2}\) = 3.4
Question 13.
The median of the following observations, arranged in ascending order is 15. 10, 12, 14, x – 3, x, x + 2, 25.Then find x.
Solution:
Given observations are
10, 12, 14, x – 3,x ; x + 2, 25
⇒ n = 7 (is an odd)
∴ Median = \(\frac{n+1}{2}=\frac{7+1}{2}\) = 4th term
= x – 3
⇒ x-3 = 15
⇒ x = 15 + 3
∴ x = 18
Question 14.
Find the mode of 10, 12, 11, 10, 15, 20, 19, 21, 11, 9, 10
Solution:
The given observations are
10, 12, 11, 10, 15, 20, 19,21,11,9, 10
∴ The most frequently occurring observation is 10.
∴ Mode = 10
![]()
Question 15.
Mode of certain scores is x. 1f each score is decreased by 3, then find the mode of the new series.
Solution:
The mode of some observations is ‘x’. If ‘3’ is subtracted from every observa¬tion then the mode = x – 3
Question 16.
Find the mode of all digits used in Titing the natural numbers from 1 to 100.
Solution:
Natural numbers from 1 to 100 are 1,2,3, …………….99, 100
∴ It has no mode.
[ ∵ Every number appears only once]
Question 17.
Observations of a raw data are 5, 28, 15, 10, 15, 8, 24. Add four more numbers so that mean and median of the data remain the same, but mode increases by 1.
Solution:
The given observations are 5, 28, 15, 10, 15, 8, 24
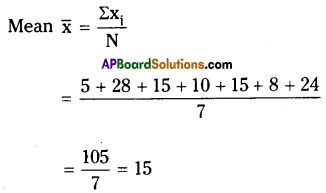
Ascending order of the observations 5, 8, 10, 15, 15, 24, 28
Median = \(\frac{n+1}{2}=\frac{7+1}{2}\) = 4 th term
= 15 [n = 7 is an odd]
∴ Mode = 15
If 4 observations are inserted for the given data then mode increases by 1.
Let x1 = x2 = x3 = x say .
∴ The mean
= \(\frac{x+x+x+x_{4}+10}{11}\) = 15
⇒ 3x + x4 = 165 – 105 = 60
∴ 3x + x4 = 60
If mode will increases by 1 then
x= 15 +1 = 16
∴ 3x + x4 = 60
⇒ 3 x 16 + x4 =60
⇒ x4 = 60 – 48 = 12
∴ The required 4 observations are 12, 16, 16, 16
![]()
Question 18.
If the mean of a set of observations x1, x1 , x10 is 20. Find the mean of x1 + 4, x2 + 8, x3 + 12 , x10 + 40.
Solution:
Mean of observations x1, x2……………….. ,x10 is
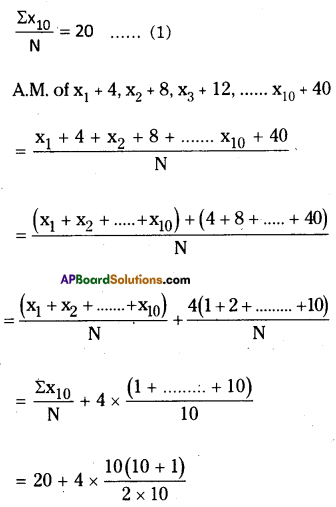
= 20 + 2 × 11 = 20 + 22 = 42
![]()
Question 19.
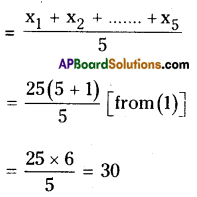
Six numbers from a list of nine integers are 7,8,3, 5,9 and 5. Find the largest possible value of the median of all nine numbers in this list.
Solution:
The given 6 integers are 7, 8, 3, 5, 9, 5
Ascending order = 3, 5, 5, 7, 8, 9
Let the remaining 3 observations be x1, x2, x3 say
Median of 3, 5, 5, 7, 8, 9, x1, x2, x3 is
= \(\frac{n+1}{2}\) [ ∵ n is an odd (9)]
= \(\frac{9+1}{2}\) = 5th term = 8
∴ The largest possible median will be 8
Question 20.
The median of a set of 9 distinct observations is 20. If each of the largest 4 observations of the set is increased by 2, find the median of the resulting set.
Solution:
Let the 9 observations be x1, x2………..x9 say
Median = \(\frac{n+1}{2}\) [∵ n = 9 is an odd]
= \(\frac{n+1}{2}\) = 5th term = x5 = 20
∴ x5 = 20
If 2 is added to the last 4 largest numbers then x1, x2, x3, x4, x5, x6 + 2 x7 + 2, x8 + 2, x9 +2
∴ Median = \(\frac{n+1}{2}=\frac{9+1}{2}\) = 5th term
∴ x5 = 20