AP State Syllabus AP Board 6th Class Maths Solutions Chapter 12 Data Handling Unit Exercise Textbook Questions and Answers.
AP State Syllabus 6th Class Maths Solutions 12th Lesson Handling Unit Exercise
![]()
Question 1.
Given below are the ages of 20 Students of Class VI in a School.
i) Organise the data and represent in the form of a frequency distribution table using tally marks.
ii) Find out the age having more number of students.
iii) How many students are there in 10 Years age?
iv) Find out No. of Students who are having more age.
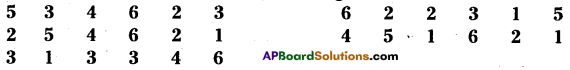
13, 10, 11, 12, 10, 11, 11, 13, 12, 11
10, 11, 12,11, 13, 11, 10, 13, 10, 12
Solution:
i)
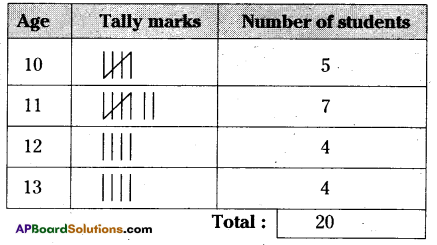
ii) More number of students have 11 years age.
iii) 5 students are there in 10 years age.
iv) 7 students having more age.
Question 2.
A dice was thrown 30 times and following scores were obtained
i) Prepare a frequency table of the scores.
ii) Which number obtained more times?
iii) How many times was a score greater than 4 obtained,
iv) Find the total number of times an odd number obtained.
Solution:
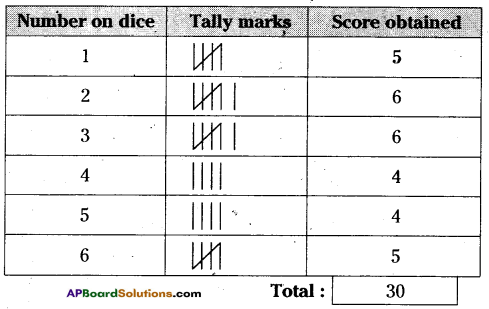
ii) 2 and 3 numbers obtained more times.
iii) Total numbers of times obtained greater than 4 are 22,
iv) Two times an odd number is obtained.
Question 3.
Following is the data regarding pass percentage of students in different classes.
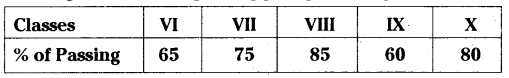
Draw a vertical bar graph to represent the above data.
Solution:
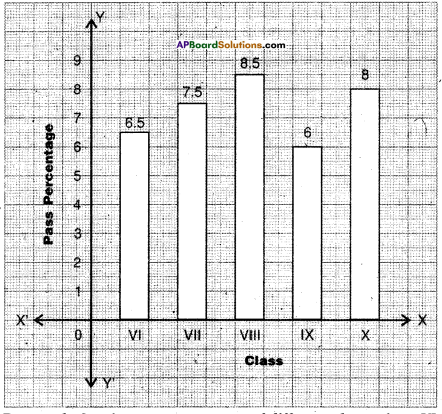
Bar graph showing pass percentage of different classes from VI to X.
Steps of construction:
- Draw two mutually perpendicular lines on a graph sheet – one horizontal (X-axis) and one vertical (Y-axis) mark. Number of class on the X-axis and their pass percentage on the Y-axis.
- Take the 10 as scale on the Y-axis i.e., 1 cm = 10%
- Calculate the lengths or heights of the bars by dividing the pass percentage with the scale.
Class VI = 65 ÷ 10 = 6.5 cm
Class VII = 75 ÷ 10 = 7.5 cm
Class VIII = 85 ÷ 10 = 8.5 cm
Class IX = 60 ÷ 10 = 6 cm
Class X = 80 ÷ 10 = 8 cm - Draw rectangular vertical bars of same width (I cm) on the X-axis with their calculated heights.
Hence, required vertical bar graph was constructed.
Question 4.
The number of Mathematics books sold by a shopkeeper on Six consecutive days is shown below.
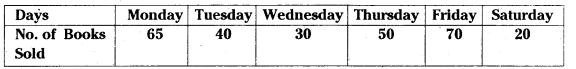
Draw a Horizontal Bar graph to represent the above data.
Solution:
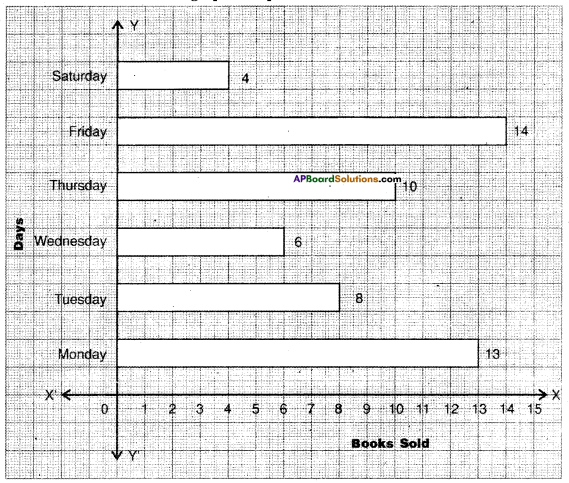
Bar graph showing the percentage of books sold In a week days.
Steps of construction:
- Draw two mutually perpendicular lines on a graph sheet – one horizontal (X-axis) and one vertical (Y-axis).
- Mark name of the day on the Y-axis and the number of books sold on the X-axis.
- Take the 10 as scale on the X-axis i.e., 1cm = 5 books.
On Monday = 65 ÷ 5 = 13 cm
On Wednesday = 30 ÷ 5 = 6 cm
On Friday = 70 ÷ 5 = 14 cm
On Tuesday = 40 ÷ 5 = 8 cm
On Thursday = 50 ÷ 5 = 10 cm
On Saturday = 20 ÷ 5 = 4 cm - Calculate the lengths of the bars by dividing the number of books with the scale.
- Draw rectangular horizontal bars of same width (1cm) on the Y-axis with their calculated lengths.
Hence, required horizontal bar graph was constructed.