Practice the AP 10th Class Maths Bits with Answers Chapter 14 Statistics on a regular basis so that you can attempt exams with utmost confidence.
AP State Syllabus 10th Class Maths Bits 14th Lesson Statistics with Answers
Question 1.
The mode of the values sin 0°, cos 0°, sin 90° and tan 45° is
A) 0
B) √3
C) 1
D) \(\)
Answer:
C) 1
Question 2.
Match the following.
Set – A
1. If the median of \(\frac{x}{5}, \frac{x}{3}, \frac{x}{4}\) is 5, then x =………………
2. Mean of the scores 1 – x, 1, x + 1 is …………………
3. If the mode of x, \(\frac{x}{2}, \frac{x}{2}, \frac{x}{3}, \frac{x}{3}, \frac{x}{3}\) is 5, then x = …………………
Set – B
(P) 15
(q) 20
(r) 1
A) 1 → r, 2 → p, 3 → q
B) 1 → q, 2 → r, 3 → p
C) 1 → q, 2 → p, 3 → r
D) 1 → p, 2 → r, 3 → q
Answer:
B) 1 → q, 2 → r, 3 → p
![]()
Question 3.
Median of the scores 1, 3, 5, 7, 9, …………………… 99 is …………………..
A) 51
B) 50
C) 49
D) 48
Answer:
B) 50
Question 4.
Which one of the following is NOT a measure of central tendency ?
A) Mean
B) Median
C) Range
D) Mode
Answer:
C) Range
Question 5.
For the terms, x + 1, x + 2, x – 1, x + 3 and x – 2(x ∈ N), if the median of the data is 12, then x = ………………….
A) 9
B) 10
C) 11
D) 13
Answer:
C) 11
Question 6.
3, 2, 4, 3, 5, 2, x, 6. If the mode of this data is 3, then x = ………………..
A) 4
B) 3
C) 2
D) 5
Answer:
B) 3
Question 7.
Median of 2, 3, 4, 5, 6, 7 is ……………….
A) 2
B) 5.5
C) 5
D) 4.5
Answer:
D) 4.5
Question 8.
To elect the leader of your class from 3 contestants, which of the following measures are to be considered ?
A) Mean
B) Mode
C) Median
D) Range
Answer:
B) Mode
Question 9.
From the given graph of Ogives, median is ………………..
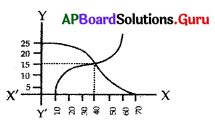
A) 15
B) 10
C) 40
D) 20
Answer:
C) 40
![]()
Question 10.
Mid values are used to find
A) mean
B) median
C) mode
D) range
Answer:
A) mean
Question 11.
The mean df first five prime numbers is
A) 4
B) 4.6
C) 5.6
D) 5
Answer:
C) 5.6
Question 12.
Median of the data 6, 10, 20, x, 12, 14 is 12, then x =
A) 6
B) 10
C) 4
D) 14
Answer:
B) 10
Question 13.
The A.M of a + 2, a, a – 2 is ……………….
A) a + 2
B) a
C) a – 2
D) 3a
Answer:
B) a
Question 14.
The midvalue of the class 10 – 19 is ………………….
A) 24.5
B) 20.5
C) 23.5
D) 14.5
Answer:
D) 14.5
Question 15.
Cumulative frequency are used in ……………… calculations.
A) A.M.
B) median
C) range
D) mode
Answer:
B) median
Question 16.
While drawing ogive curve we take on X-axis and Y-axis the following respectively.
A) class interval, frequency
B) lower boundary, upper boundary
C) boundaries, cumulative frequency
D) upper boundary, lower boundary
Answer:
C) boundaries, cumulative frequency
![]()
Question 17.
The mean of 10 observations is 16.3. By an error, one observation is registered as 32 instead of 23, the correct mean is …………………..
A) 16.1
B) 18.5
C) 15.4
D) 14.8
Answer:
C) 15.4
Question 18.
The mean of data is. 10. If each observation is multiplied by 2 and 1 is subtracted from each result, the mean of the new observation is ………………..
A) 21
B) 19
C) 9
D) 10
Answer:
B) 19
Question 19.
The mean of 1, 3, 4, 5, 7, 4 is m. The numbers 3, 2, 2, 4, 3, 3, p have mean m – 1 and median q, then p + q = …………………..
A) 4
B) 3
C) 6
D) 7
Answer:
D) 7
Question 20.
If the median of the data : 24, 25, 26, x + 2, x + 3, 30, 31, 34 is 27.5, then (Data in the ascending order) is ………………..
A) 27
B) 25
C) 28
D) 30
Answer:
B) 25
Question 21.
Constructing of a cumulative frequency table is useful in finding………………..
A) median
B) mean
C) mode
D) mean, median, mode
Answer:
A) median
Question 22.
The abscissa of the point of inter section of less than type and more than type ogive curves gives ………………….
A) median
B) mean
C) mode
D) standard deviation
Answer:
A) median
Question 23.
The mode of data 3, 3, 4, 5, 3, 5, 6, 3, 7, 9, 11, 7
A) 3
B) 7
C) 3 or 7
D) does not exist
Answer:
A) 3
![]()
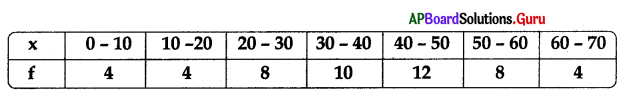
Question 24.
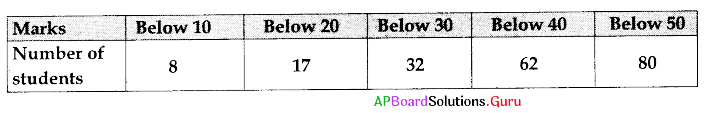
In the above distribution the modal class is
A) 10-20
B) 20-30
C) 30-40
D) 40-50
Answer:
C) 30-40
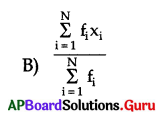
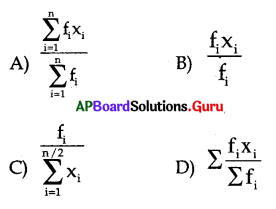
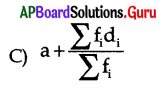
Question 25.
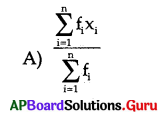
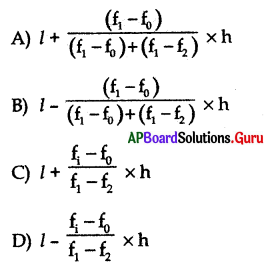
The mean of n observations X1, X2, ………………., Xn repeated f1, f2, …………….., fn times respectively is
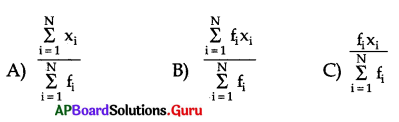
D) None
Answer:
Question 26.
The sum of lower limit of median class and upper limit of model class is
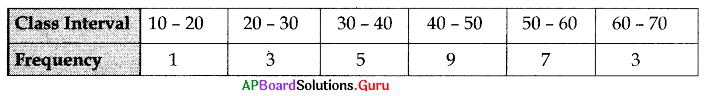
A) 60
B) 40
C) 90
D) 50
Answer:
B) 40
Question 27.
A data has 13 observations arranged in descending order. Which observation presents the median of the data ?
A) 17th
B) 6th
C) 7th
D) None
Answer:
C) 7th
Question 28.
Cummulative frequency is used to calculate
A) median
B) mode
C) mean
D) None
Answer:
A) median
Question 29.
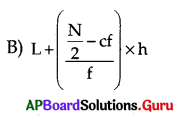
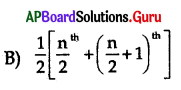
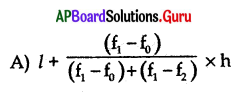
Under the usual notations the formula for calculating mode for grouped frequency distribution is
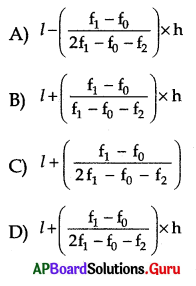
Answer:
Question 30.
Themean of a + 1,a + 3,a + 4 and a + 8 is
A) a + 7
B) a + 4
C) a – 3
D) None
Answer:
C) a – 3
![]()
Question 31.
If 5 is added to each and every item of a data, then the arithmetic mean is
A) 5 times to the first arithmetic mean
B) increased by 5 to the first arithmetic mean
C) equal to the first arithmetic mean
D) None
Answer:
B) increased by 5 to the first arithmetic mean
Question 32.
The median of 24, 20, 32, 18, 28, 16, 25 is
A) 18
B) 16
C) 24
D) 32
Answer:
C) 24
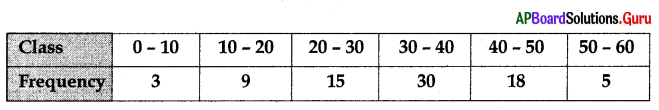
Question 33.
The median of the following distribution is
A) 23.75
B) 23.25
C) 25.125
D) None
Answer:
C) 25.125
Question 34.
For the data 9, 8, 7, 7, 6, 3, 7, 2, 1, 7, 9 the mode is
A) 9
B) 7
C) 3
D) 2
Answer:
B) 7
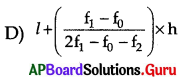
Question 35.
The modal class of following distribution is
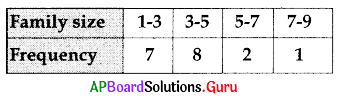
A) 1 – 3
B) 3 – 5
C) 5 – 7
D) None
Answer:
B) 3 – 5
Question 36.
The arithmetic mean of 12, 15, 13, 20, 25 is
A) 17
B) 20
C) 18
D) None
Answer:
A) 17
Question 37.
The width of the class in the distribution having class intervals 1 – 20, 21 – 40,41 – 60 is
A) 19
B) 19.5
C) 20
D) 20.5
Answer:
C) 20
![]()
Question 38.
The arithmetic mean of the following data is
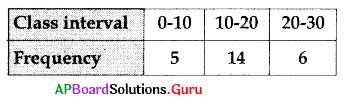
A) 18.4
B) 19.4
C) 12.4
D) 15.4
Answer:
D) 15.4
Question 39.
If mean = 44 and median = 42, then mode =
A) 34
B) 36
C) 38
D) 40
Answer:
C) 38
Question 40.
Which of the following is more consistent ?
A) AM
B) Median
C) Mode
D) None
Answer:
A) AM
Question 41.
The mode of 5, \(\frac{x}{2}\), 6,7, \(\frac{x}{2}\), 3, \(\frac{x}{2}\) is 9. Then the value of x is
A) 3
B) 4.5
C) 2
D) 18
Answer:
B) 4.5
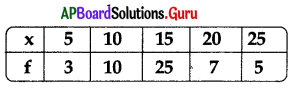
Question 42.
Find the mean of the marks of the students from the given table :
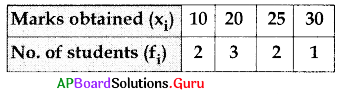
A) 20
B) 25
C) 15
D) 10
Answer:
C) 15
Question 43.
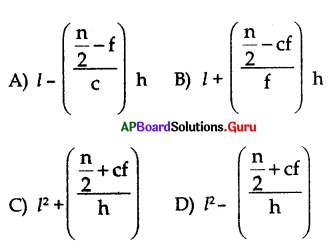
The median of the grouped data can be calculated using the formula
Answer:
Question 44.
The median of 5, 3, 10, 7, 2, 9, 11, 2 is
A) 6
B) 5
C) 7
D) 2
Answer:
C) 7
![]()
Question 45.
The median of 5, 6, 9,10, 8,4, 3, 7,11 is
A) 8
B) 7
C) 9
D) 6
Answer:
D) 6
Question 46.
If the Arithmetic mean of 8, 6,4, x, 3, 6, 0 is 4; then the value of x = ……………..
A) 7
B) 6
C) 1
D) 4
Answer:
C) 1
Question 47.
Extreme values in the data affect …………………
A) Arithmetic mean
B) Median
C) Mode
D) Range
Answer:
A) Arithmetic mean
Question 48.
Which of the following is NOT a measure of central tendency ?
A) Range
B) Mode
C) Median
D) Mean
Answer:
A) Range
Question 49.
Length of the class 11-20 is ………………
A) 9
B) 10
C) 11
D) 20
Answer:
B) 10
Question 50.
In “More than Ogive curve”, we consider in drawing ……………………
A) more than cumulative frequency, lower limits
B) more than cumulative frequency, upper limits
C) less than cumulative frequency, lower limits
D) less than cumulative frequency, upper limits
Answer:
A) more than cumulative frequency, lower limits
Question 51.
Observe the following tables :
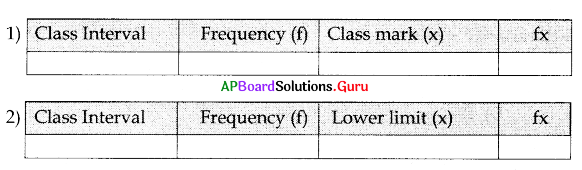
For finding Arithmetic Mean by Direct method, the suggested frequency distribution table is ………………..
A) Only (1) is true
B) Only (2) is true
C) (1) and (2) are true
D) None of the above
Answer:
A) Only (1) is true
![]()
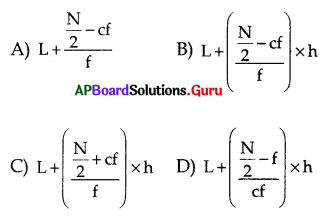
Question 52.
Median = l + \(\left[\frac{\left(\frac{n}{2}-c f\right)}{f}\right]\) h, where cf = ………………….
A) Cumulative frequency of the class preceding the median class.
B) Cumulative frequency of the median class.
C) Cumulative frequency of the class succeeding the median class.
D) Sum of the frequencies.
Answer:
A) Cumulative frequency of the class preceding the median class.
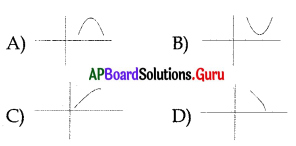
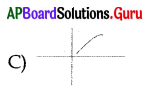
Question 53.
Observe the following graphs.
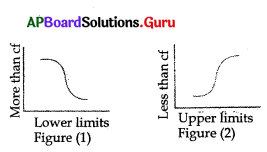
Which of the above given figures represents ‘less than’ Ogive curve ?
A) Only (1) is true
B) Only (2) is true
C) Both (1) and (2) are true
D) None of these
Answer:
B) Only (2) is true
Question 54.
Range of first 5 natural numbersds
A) 0
B) 4
C) 5
D) 9
Answer:
B) 4
Question 55.
Class interval of 1 – 10 is
A) 8
B) 12
C) 11
D) 10
Answer:
D) 10
Question 56.
In a data maximum value = x; minimum value = y. Then range
A) x + y
B) x – 1
C) x – y
D) x + 1
Answer:
C) x – y
Question 57.
Mid value of the class 10 – 20 is
A) 15
B) 13
C) 12
D) 10
Answer:
A) 15
Question 58.
The class interval of the classes 0 – 7, 7 – 14,14 – 21 ………………….etc.,is
A) 0
B) 7
C) 9
D) 8
Answer:
B) 7
![]()
Question 59.
The mean of a – 2, a, a + 2 is …………………
A) 3a
B) \(\frac{\mathrm{a}}{3}\)
C) 1
D) a
Answer:
D) a
Question 60.
The sum of all deviations taken from Mean =
A) 0
B) -1
C) 1
D) 2
Answer:
A) 0
Question 61.
A data arranged in descending order has 25 observations. Which observation represents the median ?
A) 15th
B) 14th
C) 13th
D) 12th
Answer:
C) 13th
Question 62.
The median of 3, 6, 1, 16, 8, 12 is …………………
A) 12
B) 6
C) 9
D) 8
Answer:
B) 6
Question 63.
Mode of the data 1, 1, 1, 1, 5, 5, 5, 5 is …………………….
A) 5
B) 1
C) 3
D) doesn’t exist
Answer:
D) doesn’t exist
Question 64.
Mean of 3, 5, 0, x, 11 is 7, then x =
A) 3
B) 4
C) 7
D) 5
Answer:
C) 7
Question 65.
Range = 25; Maximum value = 30, then the Minimum value is ………………….
A) 9
B) 8
C) 5
D) 7
Answer:
C) 5
![]()
Question 66.
The sum of 12 observations is 240, then mean is ……………….
A) 10
B) 12
C 16
D) 20
Answer:
D) 20
Question 67.
If the mean and mode of a grouped data is 24 and 26.5 respectively then the median is …………………
A) 24. 38
B) 24. 83
C) 23. 48
D) 23. 84
Answer:
B) 24. 83
Question 68.
The median of the ungrouped data 2, 12, 7, 5, 10 and 6 is
A) 5.5
B) 6
C) 13
D) 6.5
Answer:
D) 6.5
Question 69.
Median = 52.5; Mean = 54 then mode
A) 49.5
B) 48.5
C) 40. 5
D) 60.1
Answer:
A) 49.5
Question 70.
Mode = 24.5, Mean = 29.75, then Median = ………………….
A) 28
B) 16
C) 20
D) 82
Answer:
A) 28
Question 71.
Σ f (x) = 200; n = 20, then \(\overline{\mathbf{x}}\) =
A) 29
B) 20
C) 16
D) 10
Answer:
D) 10
Question 72.
The AM of 10 numbers is 20, AM of 30 numbers is 60. AM of combined data is ………………………
A) 40
B) 12
C) 13
D) 50
Answer:
D) 50
Question 73.
Mean of 8, 6, 4, x, 3, 6, 0 is 4, then x =
A) 0
B) 1
C) 4
D) 14
Answer:
B) 1
![]()
Question 74.
Mean of -3, -2, -1,0, 1, 2, 3 is
A) 0
B) -1
C) -2
D) 3
Answer:
A) 0
Question 75.
The median of 8, 10, 4, 3, 2, 11, 1 is
A) 4
B) 3
C) 7
D) 8
Answer:
A) 4
Question 76.
The median of scores x1, x2 and 2x1, is 6 and x1 < 2x1 < x2 then x1 = ………………….
A) 7
B) 13
C) 3
D) 6
Answer:
C) 3
Question 77.
The range of first n natural numbers is …………………
A) n + 1
B) n – 1
C) n
D) 2n -1
Answer:
B) n – 1
Question 78.
Median of 1 to 9 natural numbers is …………………
A) 5
B) 6
C) 7
D) 4
Answer:
A) 5
Question 79.
Median of \(\frac{3}{4}, \frac{1}{2}, \frac{2}{3}, \frac{1}{6}, \frac{7}{12}\) is
A) \(\frac{2}{7}\)
B) \(\frac{7}{9}\)
C) \(\frac{7}{12}\)
D) \(\frac{2}{3}\)
Answer:
C) \(\frac{7}{12}\)
Question 80.
Mean of a – 2d, a – d, a + d and a + 2d is
A) -a
B) 3a
C) a
D) 5a
Answer:
C) a
![]()
Question 81.
The mean of first 5 odd multiples of 5 is
A) 15
B) 20
C) 25
D) 35
Answer:
C) 25
Question 82.
The mean of 10 numbers is 7. The mean of 15 numbers is 12 then the mean of all observations is ……………………
A) 9
B) 10
C) 12
D) 11
Answer:
B) 10
Question 83.
Mode of 2004, 2005, 2006, ………………… 2015 is ………………….
A) 2004
B) 2015
C) 2009
D) no mode
Answer:
D) no mode
Question 84.
The sum of the lower limit and upper limit of the modal class from the above distribution table.
A) 90
B) 110
C) 70
D) 50
Answer:
C) 70
Question 85.
Mean of first ‘n’ natural numbers is ……………………
A) n
B) \(\frac{\mathrm{n}}{2}\)
C) \(\frac{\mathrm{n}-1}{2}\)
D) \(\frac{n+1}{2}\)
Answer:
D) \(\frac{n+1}{2}\)
Question 86.
The mean of a data is 9. If each observation is multiplied by 3 and then 1 is added to each result, then the mean of new observation is…………………….
A) 19
B) 20
C) 28
D) 30
Answer:
C) 28
Question 87.
Average of 11 scores is 10.5. If one score 9 is deleted, then the average of the remaining scores is ………………….
A) 10.16
B) 10.06
C) 10.65
D) 13.6
Answer:
C) 10.65
![]()
Question 88
……………… is effected by extreme values.
A) Mean
B) Mode
C) Median
D) Mean and Median
Answer:
A) Mean
Question 89.
If each observation of data is increased by ‘a’ then mean is increases by………………….
A) a
B) \(\frac{a}{2}\)
C) a2
D) a + 1
Answer:
A) a
Question 90.
To find median, classes should be ……………….
A) of same frequencies
B) of same length
C) continuous
D) discontinuous
Answer:
C) continuous
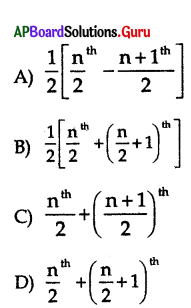
Question 91.
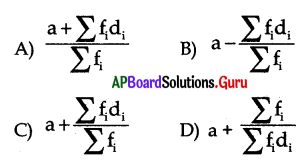
For a distribution with odd number (n) of observations, the median is ……………… observation
A) \(\frac{n^{\text {th }}}{2}\)
B) (\(\frac{n+1}{2}\))th
C) \(\frac{n-1}{2}\))th
D) \(\frac{\mathrm{n}}{2}\) – 1) th
Answer:
B) (\(\frac{n+1}{2}\))th
Question 92.
Mean of n – observations x1, x2 ……………… xn repeated f1, f2 …………….. fn times is
Answer:
Question 93.
In the class 0 – 10,10 – 20,20 – 30,30 – 40 ……………….. lower limit of 10 – 20 is
A) 10
B) 20
C) 30
D) 15
Answer:
A) 10
Question 94.
Which of the following is not a measure of central tendency ?
A) Mean
B) Range
C) Mode
D) Median
Answer:
B) Range
![]()
Question 95.
Which of the following is same as representative of the whole class ?
A) Lower limit
B) Length of the class
C) Upper limit
D) Midpoint
Answer:
D) Midpoint
Question 96.
The information collected is called
A) Data
B) Mean
C) Median
D) Mode
Answer:
A) Data
Question 97.
Which of the following measures do you use to find average of marks obtained by a student in the class
A) Mean
B) Median
C) Mode
D) Range
Answer:
A) Mean
Question 98.
For a symmetrical distribution, which is correct ?
A) Mean > Median > Mode
B) Mean < Median < Mode
C) Mean = Median = Mode
D) \(\frac{\text { Mean }+\text { Median }}{2}\) = Mode
Answer:
C) Mean = Median = Mode
Question 99.
For a continuous grouped frequency distribution, the median is given by
Answer:
Question 100
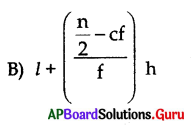
For a distribution with even number (n) of observations the median is ……………… terms.
Answer:
![]()
Question 101.
Mode of a continuous grouped distribution is
Answer:
Question 102.
If xi and fi are sufficiently small, then which method is an appropriate choice to find mean
A) Assumed – Mean method
B) Step deviation method
C) Direct method
D) Class interval method
Answer:
C) Direct method
Question 103.
If assumed mean is ‘a’, then mean =
Answer:
Question 104.
In the formula of Mode in the grouped data ‘l’ represents
A) lower limit of the class with highest frequency
B) lower limit of the class with lowest frequency
C) upper boundary of the class with highest frequency
D) lower boundary of the class with low frequency
Answer:
A) lower limit of the class with highest frequency
Question 105.
………………… of all bars is same in bargraph.
A) Length
B) Width
C) Circle
D) Height
Answer:
B) Width
Question 106.
In the formula of median in the grouped data ‘l’ represents
A) upper limit of the median class
B) lower limit of the median class
C) upper boundary of the median class
D) lower boundary of the median class
Answer:
B) lower limit of the median class
Question 107.
The class mark of a class interval is
A) upper boundary + lower boundary
B) upper boundary – lower boundary
C) \(\frac{\text { upper boundary + lower boundary }}{2}\)
D) \(\frac{\text { upper boundary – lower boundary }}{2}\)
Answer:
C) \(\frac{\text { upper boundary + lower boundary }}{2}\)
Question 108.
![]() || represents
|| represents
A) 5
B) 6
C) 7
D) 10
Answer:
C) 7
![]()
Question 109
………………… is known as Father of Statistics.
A) Thales
B) Fisher
D) Cayley
D) Thompson
Answer:
B) Fisher
Question 110.
Number of items in a class interval is called
A) Range
B) Class
C) Frequency
D) Raw data
Answer:
C) Frequency
Question 111.
Mid values are used to calculate
A) Median
B) Mode
C) Mean
D) Range
Answer:
C) Mean
Question 112.
Mode is the value of variable which occurs ………….. number of times.
A) Minimum
B) Zero
C) Maximum
D) 2
Answer:
C) Maximum
Question 113.
We use ……………… to conclude which school has a better performance in an examination.
A) Median
B) Mean
C) Mode
D) Cumulative frequency
Answer:
B) Mean
Question 114.
Representing data with the help of pictures is called
A) bargraph
B) data
C) pictograph
D) line graph
Answer:
C) pictograph
Question 115.
Histograms consists of
A) circles
B) rectangles
C) sectors
D) squares
Answer:
B) rectangles
Question 116.
Pie diagram consists of
A) rectangles
B) squares
C) circles
D) sectors
Answer:
D) sectors
![]()
Question 117.
If the mean of x1, x2, x3 ………………… xn is \(\overline{\mathbf{x}}\) then the mean of \(\frac{\mathbf{x}_{1}}{\mathbf{a}}, \frac{\mathbf{x}_{\mathbf{2}}}{\mathbf{a}}\) ……………… \(\frac{\mathbf{x}_{\mathrm{n}}}{\mathrm{a}}\) is
A) a . \(\overline{\mathbf{x}}\)
B) \(\overline{\mathbf{x}}\) – a
C) \(\frac{\overline{\mathbf{x}}}{\mathbf{a}}\)
D) \(\overline{\mathbf{x}}\) + a
Answer:
C) \(\frac{\overline{\mathbf{x}}}{\mathbf{a}}\)
Question 118.
Empirical relation among Mean, Median and Mode is
A) Mode = 3 Median – 2 Mean
B) Mode = 2 Median – 3 Mean
C) Mode = 3 Median – Mean
D) Mode = Median – Mean
Answer:
A) Mode = 3 Median – 2 Mean
Question 119.
x – coordinate of point of inter-section of the cumulative frequency ogive is
A) Range
B) Median
C) Mean
D) Mode
Answer:
B) Median
Question 120.
We use ………………. to conclude average IQ (Intelligent Quotient)of a students in a class
A) Median
B) Mean
C) Mode
D) Range
Answer:
A) Median
Question 121.
Construction of cumulative frequency table is useful in determining the
A) Mean
B) Median
C) Mode
D) Range
Answer:
B) Median
Question 122.
The mean of the following data is
A) 15. 0
B) 15. 1
C) 15. 9
D) 16. 2
Answer:
B) 15. 1
Question 123.
Mode from the following data is
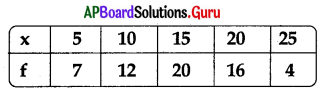
A) 5
B) 25
C) 15
D) 10
Answer:
C) 15
![]()
Question 124.
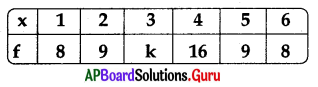
The mean of the above data is 3.55 then k =
A) 10
B) 12
C) 31
D) 41
Answer:
A) 10
Question 125.
The mean class of the following distribution is
A) 60 – 70
B) 50 – 60
C) 40 – 50
D) 30 – 40
Answer:
D) 30 – 40
Question 126.
For a given data with observation the ‘less than Ogive’ and ‘more than Ogive’ intersect
at (15.5, 20). The median of the data is
A) 20
B) 15.5
C) 10.5
D) 4.5
Answer:
B) 15.5
Question 127.
The modal class in the following frequency distribution is
A) 30 – 40
B) 40 – 50
C) 50 – 60
D) 20 – 30
Answer:
A) 30 – 40
Question 128.
The abscissa of the point of inter-section of the less than type and greater than type cumulative frequency curves of a grouped data gives its …………………….
A) Mean
B) Median
C) Mode
D) Range
Answer:
B) Median
Question 129.
Which of the following graph represents LCF curve
Answer:
Question 130.
Identify GCF curve from the following
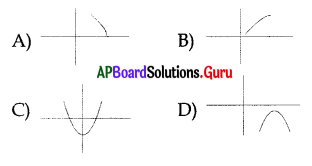
Answer:

Question 131.
The adjancent figure represents ………………
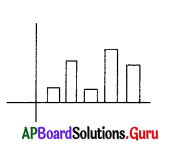
A) Histogram
B) Pie chart
C) Picto graph
D) Range
Answer:
A) Histogram
![]()
Question 132.
In a pie chart we communicate the data with the figures which are in the form of …………………….
A) Circles
B) Sectors
C) Lines
D) Rectangles
Answer:
B) Sectors
Question 133.
Which of the following is difficult to construct always ?
A) Pie chart
B) Bar graph
C) Range
D) Picto graph
Answer:
D) Picto graph