AP State Syllabus AP Board 6th Class Maths Solutions Chapter 12 Data Handling InText Questions and Answers.
AP State Syllabus 6th Class Maths Solutions 11th Lesson Data Handling InText Questions
![]()
Let’s Do (Page No. 159)
Question 1.
Take a die. Throw it and record the number. Repeat the activity 40 times and record the numbers. Represent the data in a frequency distribution table using tally marks.
Solution:
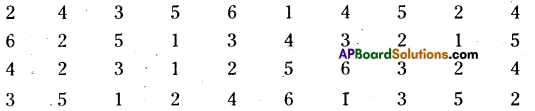
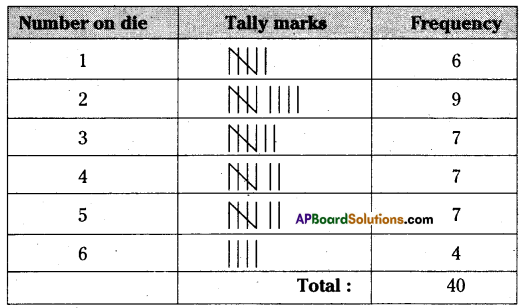
![]()
(Page No. 159)
Question 1.
In what way is the bar graph better than the pictograph ?
Solution:
Bar graphs are better indicative as they show exact numerical value. Also, to indicate negative values and positive values, it looks easier in a bar graph.